Bond traders were the original “masters of the universe.”
In his 1987 classic, The Bonfire of the Vanities, the recently deceased Tom Wolfe used the phrase to describe the bond trader at the center of the bonfire.
Within a few years, President Bill Clinton’s closest advisers would acknowledge the power of the bond market.
Clinton adviser James Carville told The Wall Street Journal: “I used to think if there was reincarnation, I wanted to come back as the president or the pope or a .400 baseball hitter. But now I want to come back as the bond market. You can intimidate everybody.”
Much has changed since that time. But the wisdom of the bond market hasn’t. Bond traders often warn of problems before traders in the stock market spot the changes.
An Obscure Indicator Shows Concerns Are Rising
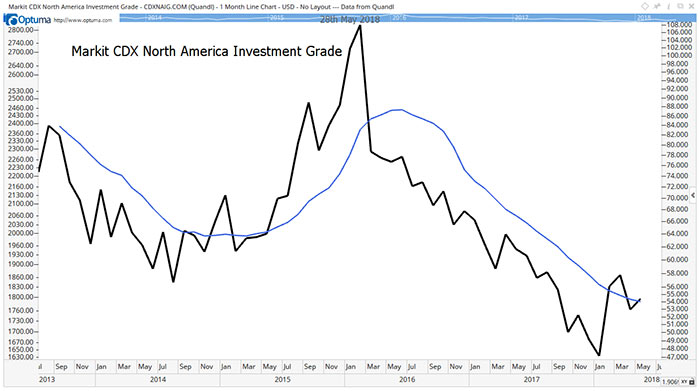
The chart below shows an important bond market indicator just turned bearish for stocks.

The black line in the chart is the Markit CDX North American Investment Grade Index. Markit is an index provider, acting like Standard & Poor’s, which calculates the S&P 500 Index for the stock market.
CDX stands for credit default swaps. An individual swap is known as a CDS. These swaps are insurance on bonds.
Let’s say I own a bond issued by General Electric Co. (NYSE: GE). The company is struggling. So, there’s at least a small chance the company can default. To avoid losses on my bond, I can buy a CDS.
The CDS transfers the risk of default to the seller. If GE defaults, the CDS seller will make up my losses. If there’s no default, I lose 100% of the amount I paid for the insurance.
Sellers act like insurance companies. They price the risk and receive premiums every three months from the buyer.
Looking at swaps on GE, the price jumped from about $63,000 to cover $10 million worth of bonds at the beginning of the year to about $100,000 now. That’s the upfront payment. Additional payments of about $25,000 every three months are also required.
Prices Track Concerns
Bond traders have a short-term focus. They’re worried about receiving interest payments every six months. To ensure the companies issuing bonds can meet their obligations, bond traders analyze balance sheets closely. They also track sales trends and listen to industry gossip.
All this helps them spot potential problems as soon as they develop. When bond traders see chances of defaults rising, they will pay more for insurance.
Rising concerns about default pushes the price of the CDX index up. When it crosses above its 10-month moving average (MA), the blue line in the chart above, we tend to see a stock market decline.
That chart shows the CDX index price jumped above the MA at the end of January. Stocks sold off after that.
The index just broke above the MA again.
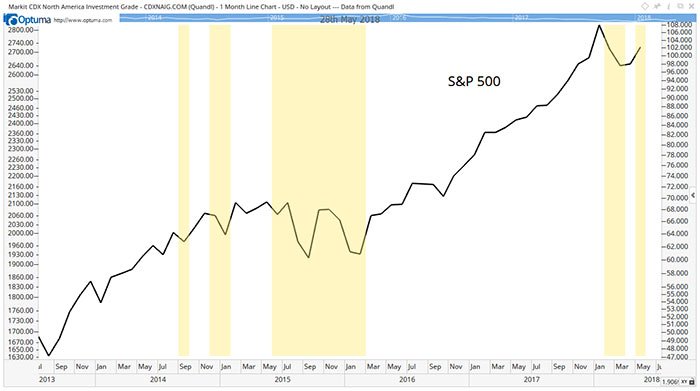
The history of this signal is shown in the next chart. Here, the yellow boxes highlight times when the CDX index is above its MA. The black line in the chart is the S&P 500 Index.

You can see the S&P 500 tends to pull back when the CDX index is above its MA.
The CDX index just crossed above its MA, an ominous sign for the stock market. Not every signal works perfectly, so this doesn’t mean now is the time to sell all stocks and move to cash. It does mean now is a time for caution and selective buying.
Regards,

Michael Carr, CMT
Editor, Peak Velocity Trader


