There’s an important market indicator you’ve likely never heard of.
Professionals use it every day.
They evaluate trading desks with it. They make sell decisions with it. It’s included in many performance reports.
And right now, this indicator is telling us we’re only halfway through this big drop in the stock market.
That means we can expect prices to fall at least 30% from their highs.
The Simplest Measure of Trading Success
This indicator is the volume-weighted average price, or VWAP.
When an investment manager buys or sells, their trade report includes VWAP. They want to buy below VWAP and sell above VWAP.
That’s the simplest measure of success for trading desks around the world.
VWAP also applies to the broad stock market.
Comparing the latest price to the VWAP for a defined time shows if average investors have a gain or loss.
Here’s Why Selling Will Accelerate
The chart below shows the SPDR S&P 500 exchange-traded fund (NYSE: SPY).
The dashed line shows VWAP from the pullback that occurred at the beginning of 2019.
VWAP for the S&P 500 Index Since March 2019
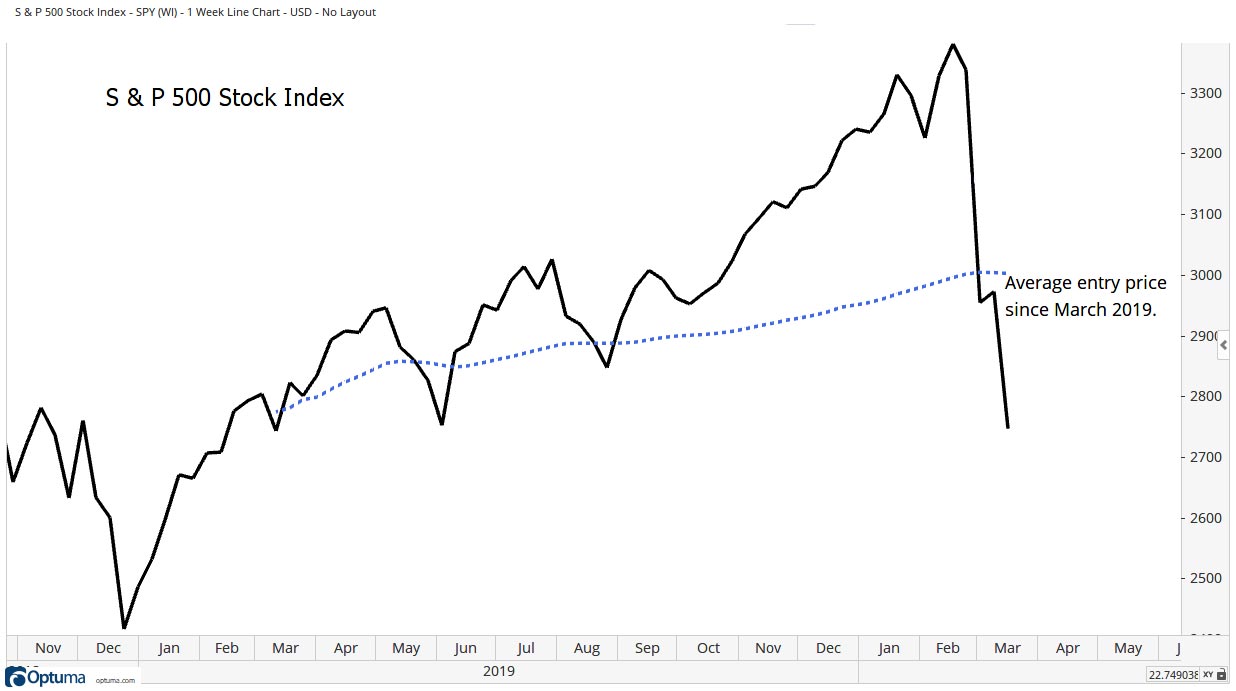
VWAP shows almost every investor who bought SPY since March 2019 has a loss. Their average loss is 8.6%.
After one year, positions count as long-term losses for tax purposes.
Many investors see tax benefits from long-term losses. As more and more positions qualify for that status, selling will accelerate.
The S&P 500 should bottom at around 2,370. That’s a 30% decline from the index’s all-time high in February.
When it reaches that bottom, you can start looking for bargains in the stock market.
Regards,
Editor, Peak Velocity Trader