
Traders often try to extrapolate the laws of physics and other scientific principles to markets.
They want to believe that rules apply. Finding the rules allows them to unlock the secrets of the stock market.
Traders aren’t alone in this belief. Economists often emulate physicists as well. Both seek formulas to explain what they see.
But there’s an obvious problem with that. In financial markets and global economies, gravity and other natural forces don’t exist.
Without those forces, prices aren’t bound by any unbreakable rules. And that means momentum indicators won’t work as expected.
A Popular Momentum Indicator
Traders built momentum indicators to spot trend reversals. They’re looking for the exact moment when a stock’s trajectory reverses.
The Relative Strength Index (RSI) is a popular momentum indicator. It’s available on many free websites.
New traders might believe it must work because it’s so popular. So, they research the rules of RSI.
They quickly find the rules make trading easy. Although RSI measures momentum, the rules say there’s no need to wait for changes in the direction of momentum.
Traders simply wait for unusually high or low readings of the indicator. Then they assume that a reversal is near. It’s almost like trading a prediction of momentum.
That’s all by design.
The Problem With RSI
RSI is a number between 0 and 100. High readings show prices accelerated to the up side. Traders expect a price decline after that.
Low readings show prices fell sharply. Traders expect prices to move up after that.
Rather than studying how prices behave, traders look for analogies in the real world. To trade RSI, they think of how runners use their energy.
They notice that a person can’t run at top speed forever. A slower pace must follow extended sprints.
RSI applies this idea to stocks. It makes it simple to trade.
Experts say RSI values above 70 are too high. They call this an “overbought” reading since high values show buyers rushed in and pushed prices up.
RSI assumes there’s limited buying power. When too many buyers rush into a market, they must be as exhausted as a runner after a long sprint. So high momentum provides a sell signal.
The chart below shows this idea is flawed.
Vertical blue lines highlight RSI values greater than 70.
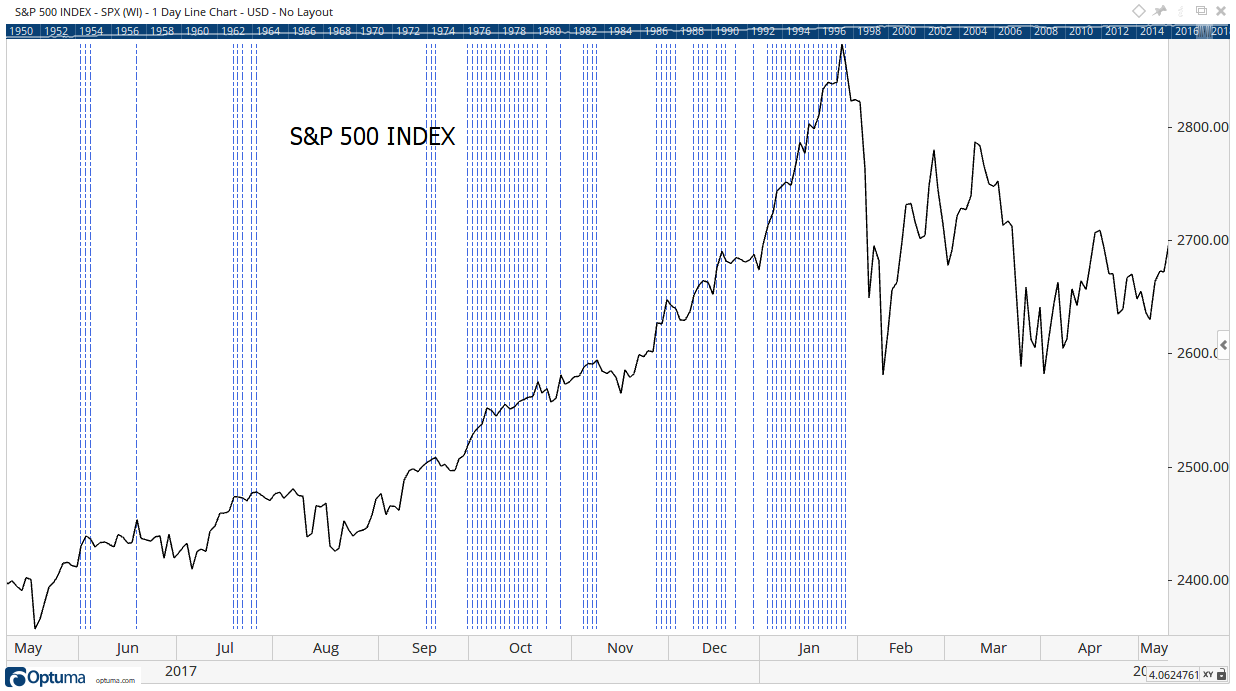
Most signals occurred during strong uptrends. Selling on high RSI meant missing most of the market’s gains.
This shows how many traders misapply momentum.
It’s not their fault, though.
Almost every book says to sell when momentum reaches overbought extremes. The books often show well-selected examples. That’s misleading.
For example, the author might show just the sell signals that worked in the chart above. Focusing on the few sell signals near tops misses the fact that most of them didn’t work.
And it’s not just RSI. Most momentum indicators don’t deliver profitable trading signals.
MACD Doesn’t Measure Momentum
It’s often categorized as a momentum indicator, but MACD (Moving Average Convergence/Divergence) follows the trend.
MACD shows the difference between two moving averages (MAs). MAs are trend-following indicators.
That’s true whether you use one, two, three or more MAs. An MA always follows the trend.
(Editor’s Note: Are you subscribed to Mike’s YouTube channel? If not, now’s a great time do to so because he’s covering a number of economic indicators in an upcoming series. Click here to check out Mike’s videos.)
It might sound like you miss market moves if you follow the trend. But following the trend is a good idea because trend-following can be profitable.
Many studies show these trading strategies work.
One in the Hedge Fund Journal reviewed “monthly returns of 84 markets in equity, fixed income, foreign exchange and commodity markets … from the 1200s through 2013.”
Over the 790 years of data, the trend-following portfolio delivered an average annual return of 13%. A buy-and-hold portfolio gained an average of 4.8%.
A Simple Strategy
Now, it’s important to remember there are two sides to every trading strategy. There are returns and there is risk. Trader need to consider both.
Better returns will almost always mean accepting more risk. In this case, trend-following increased risk by about 9% compared to buy-and-hold.
But that’s a relatively small concern since the strategy increased returns by about 170%.
This isn’t a complex strategy. The rules are simple. The authors bought a market when prices were higher than they were 12 months ago. They sold when prices were lower than they were 12 months ago.
The strategy works in both up and down markets.
This and other studies show that for long-term investors, it is almost always better to follow trends than to try to time reversals.
Manage Your Risk With MACD
By design, MACD follows trends, and history shows that can profitable.
Because it follows trends, MACD gives buy signals after prices turn up.
This indicator won’t buy at the exact bottom. Likewise, it will sell after the top.
But following trends avoids the problem seen in the chart of RSI signals shown above: Most sell signals came while prices were rising. Following RSI means missing the large gains a strong trend delivers.
MACD avoids that by signaling after the trend reversed. That makes it an important indicator.
It may even be the best risk-management indicator available to individual investors.
Regards,

Michael Carr, CMT, CFTe
Editor, Peak Velocity Trader