I noticed this morning that the search for “yield curve inversion” was trending higher on Google, along with terms such as “Powerball” and “March Madness schedule.”

I get it — Googlers are concerned that something screwy is happening to the yield curve.
You’ve probably heard this is a bad sign or an accurate predictor of recessions. And maybe you’re thinking it’s time to unload some stocks.
Predicting the economy with one indicator isn’t so simple. If economics were easy (and accurate), there would be no economists — they’d all be hedge fund managers, raking in hundreds of millions of dollars a year.
At least that’s how the free market is supposed to work.
But predicting the economy is more difficult than predicting the weather. (I’ve cursed Al Roker countless times for assuring I didn’t need my umbrella.)
Sometimes things work, and sometimes they don’t. Most of the time, the market does the exact opposite of what everyone thinks it’ll do.
When I saw that “yield curve inversion” was trending on Google, I thought it might be time to take the other side of the trade.
The Yield Curve Explained
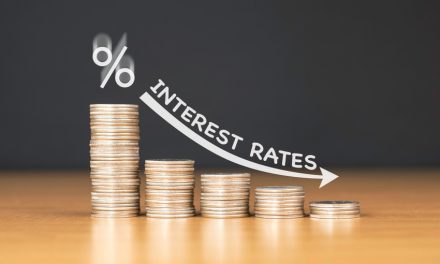
The yield curve is a depiction of interest rates plotted over the length of time to maturity. Economists use it as a tool to predict changes in economic output and growth.
There are three main types of yield curve shapes: normal, inverted and flat.
- In a normal or up sloping curve, the market expects the economy to function at a normal rate of growth.
- In an inverted yield curve, the market expects the economy to slow down and interest rates to drop in the future.
- In a flat yield curve, the market is at a point of inflection, unsure of an imminent recession or growth.
Here’s what the current U.S. Treasury yield curve looks like vs. a week ago:

The first thing you’ll notice is that, a week ago, the yield curve looked more like the Nike swoosh than a downward sloping curve.
The yields on the “belly of the yield curve” (the 3- to 7-year maturities) have dipped significantly just in the past week, suggesting the market thinks we are in a period of slower growth.
However, there is still an upslope in the spread from the 10-year to the 30-year mark, suggesting growth will continue after a dip.
But maybe the yield curve isn’t providing an accurate depiction of interest rates. After all, the Federal Reserve purchased $4 trillion of bonds over three rounds of quantitative easing.
In total, global central banks have purchased $15 trillion of longer-dated bonds.
Additionally, the belly of the curve is being yanked down by correlations with foreign bond yields. Globally, there is now $10 trillion of negative yielding debt, on mounting fears of slowing growth in Europe and Asia.
Negative yields mean you pay them! You invest in the bond, and they slowly draw down your principal until the bond matures.
Europe’s most liquid debt instrument, the German bund, now yields -0.08%. However, the German yield curve is still upwardly sloping, as the German 2-year yields -0.61% and the German 5-year yields -0.45%.
How to “Fix” the Yield Curve
Jumping back to the U.S. yield curve, only a slight cosmetic change needs to be made to make this curve upwardly sloping again: to pull the short-term rates lower.
Heck, even my 4-year-old niece can see that!
And this is where the Fed comes in. It’s been roundly criticized for raising rates too high, too quickly. Trump’s new controversial appointee to the Federal Open Market Committee, Stephen Moore, thinks the Fed should not have raised rates in December. He’s even arguing for a 50-basis-point cut.
And he’s not alone.
With the rest of the world slowing down, and an outbreak of negative yielding bonds, the market is now expecting the Fed to cut short-term rates in the next nine months.
Fed funds futures forecast only a 25.4% chance that rates will be where they are (225-250) in January 2020:

There is a 39.2% chance of a 25-basis-point cut, and a 25% chance of a 50-basis-point cut. And there’s even an 8.6% chance of a 75-basis-point cut!
This is a tailwind for stocks.
The market is suggesting the Fed will aggressively cut short-term rates this year. One rule of investing: Don’t fight the Fed.
When these cuts come to fruition, Googlers will be searching for “what stocks should I buy.” That’s when you can start thinking of lightening up on stocks.
Regards,

Ian King,
Editor, Crypto Profit Trader