

Investing can be hard.
We all know that.
But it doesn’t have to be.
Check out this chart:
These Assets Are Falling … That’s Good for Investors
This chart is the key to what the market has been doing.
Here’s why…
We’ve Seen This Before
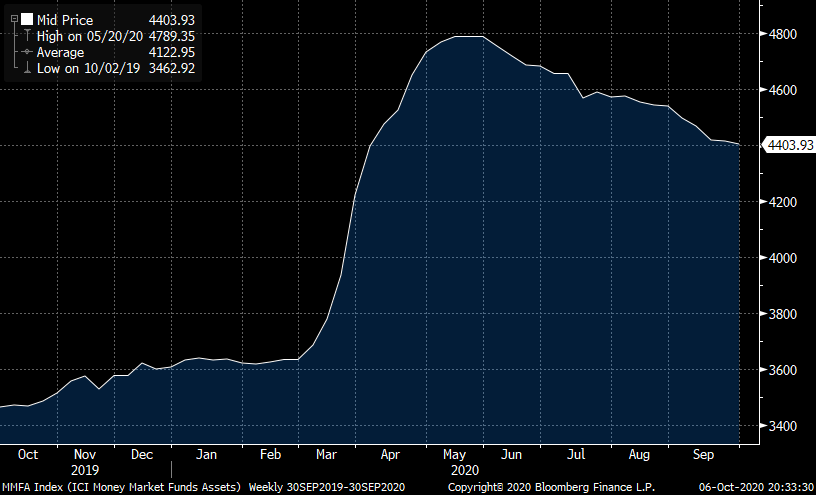
The chart is the total amount of assets in money market accounts.
You can see it’s been falling.
It may not look like much, but this is a serious drop.
The last time balances in these accounts fell this much was more than a decade ago.
Since peaking on May 20, money market balances have decreased by $385 billion. That’s an 8% drop in four months.
Where has the money gone?
Some of it went into stocks.
The Nasdaq Composite Index is up 20% over this stretch. The S&P 500 Index is up 12%.
Money market balances have moved opposite the market.
We’ve seen this before.
The last time the money market balances fell more than $200 billion was during our last crisis.
From the start of 2009 to August 2011, money markets and stocks moved opposite each other. They had a negative correlation of 0.90.
Correlation is the degree to which two assets move together. When two assets have a correlation of negative one, it means they move in the exact opposite direction. That’s what we saw back then.
The relationship is logical. When people spend their cash, it goes somewhere. This data suggests a chunk of it goes into the stock market.
As you can see in the above chart, money markets are still well above their levels from early this year.
People can draw them down further. That should continue to buoy the market.
Don’t Overthink It
If you don’t think investing could be this simple, think again.
During the depths of the recent downturn, money market assets rose by more than $1 trillion.
Some of that increase occurred when people panicked and sold their stocks. And some of it was stimulus money that went into bank accounts.
When you’re not sure if you will have a job, it makes sense to hold on to some cash.
As stocks have recovered, though, people are bidding them back up.
There’s an element of the fear of missing out, or FOMO, too.
It’s tough to stay on the sideline when stocks are rising. Especially if you were in earlier in the year.
And now the government may be on the verge of cutting more stimulus checks to people:
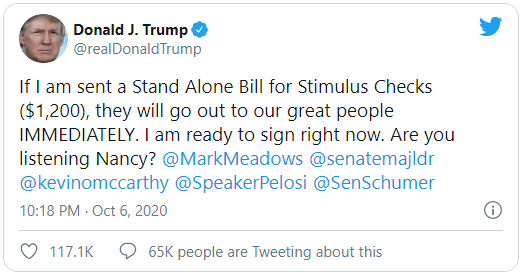
As it did earlier this year, some of this stimulus money will make its way to the stock market.
What You Should Do Now
If you’d like to know the stocks that will benefit the most as people tap their money markets and spend their stimulus checks, I encourage you to check out this report from Ian King.
Ian is a Wall Street veteran. He worked in the Salomon Brothers bond trading department made famous in the book Liar’s Poker by Michael Lewis.
He has made money in good markets and bad, including a 261% gain for the year in 2008. That was during the heart of the financial crisis.
And you’re in luck! Ian’s report just became available.
In it, he details why you must get out of cash now … and where to invest your money.
If you want to learn how to navigate this market and the cash sloshing around in it, don’t delay. This report can change your life.
Good investing,

Editor, Profit Line