Is Big Tech dead?
That’s the question on every investor’s mind right now.
In today’s video, we’re going to take a look at the three-year returns of Meta, Amazon and other Big Tech stocks.
We’re also going to look at these companies’ expected growth rates over the next three years.
(If you’d prefer to read a transcript, click here.)
Is Big Tech dead?
That’s the question on every investor’s mind right now.
Today, in this video we’re going to take a look at the three-year historic returns of Meta, Apple, Amazon, Microsoft, Netflix and Google — also known as FAAMNG, or whatever acronym it goes by now.
And we’re also going to look at the valuations of these companies.
But before we get into it, please, if you like what we have to say, give us a like by clicking the like button. If you haven’t subscribed to our videos yet, please smash that subscribe button. It helps to get our content out to the rest of the YouTube viewers.
How Has Big-Cap Tech Traded Over The Years?
So, everyone knows what’s been happening in big-cap tech. We’ve had a big sell-off to start the year. Interest rates are going up. Investors are worried about Fed Chairman Jerome Powell and inflation and a possible war between Russia and Ukraine.
So, let’s take a look at how big-cap tech has traded over the last three years, and then we’re going to go over some simple valuations to help you make better decisions on where to put your money.
Now, what I want to say about this is whenever you have something that becomes an acronym … because in the past we’ve had the BRICS, which is Brazil, Russia, India, China and South Africa.
After that, we had the PIGS: Portugal, Ireland, Greece and Spain. Those were the hot real estate markets before the housing crisis, and then those were trouble spots after the financial crisis.
So, let’s look at what’s happening in FAAMNG recently.
I want to pull up this chart of the three-year return of Meta Platforms, which was formerly known as Facebook, and Apple, Microsoft, Netflix, Amazon and Google.
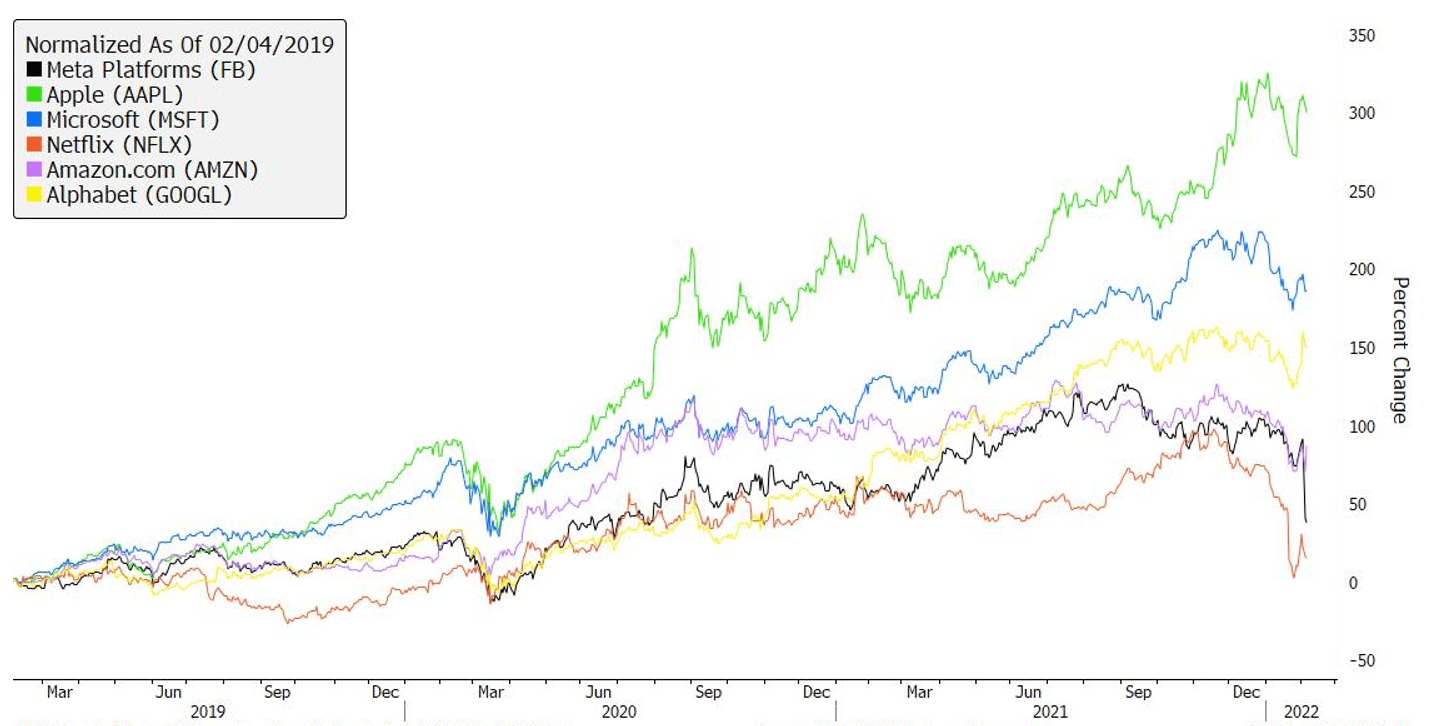
And you can see, this chart dates back three years ago. (I can’t believe that was 2019 three years ago.)
The biggest winner out of all of these is Apple. It’s up 300%.
The worst one … I wouldn’t call it a loser, but Netflix is only up about 25%. And second to last is Meta Platforms, which is up about 45% in that time frame.
And then you’ve got Amazon, which is just about equal with Meta Platforms. And you’ve got Alphabet up about 150%, Microsoft up a little under 200%.
And again, the biggest winner over the last three years, believe it or not, has been Apple. It has been really leading the charge. It’s a $2 trillion company now.
Where Will FAAMNG Be Going In The Future?
So, after we’ve seen what these companies have done in the past, what’s important is where they’re going in the future.
One way to look at that is to look at their growth rates versus their current valuations.
And this is a simple rule of thumb that can tell you whether or not a stock is expensive or cheap. So, let me just pull up this table right here.
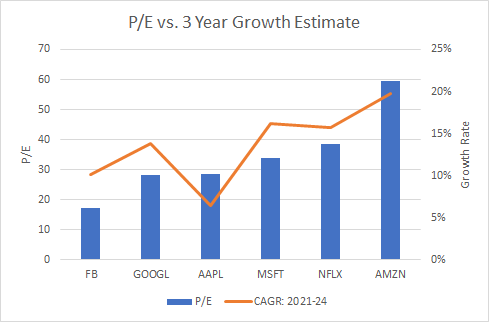
What we’ve charted, thanks to my analyst, Steve Fernandez, is basically the price-to-earnings (P/E) ratio versus the three-year earnings growth estimate.
So, it’s very simple. A P/E ratio is the price of the stock divided by what the expected earnings are this year. And that line is in blue.
Now, the orange line is the three-year compounded annual growth estimate. So, 2021, 2022, 2023 and 2024. This shows you how quickly their earnings are expected to grow over the next three years. This is a simple way to look at their growth rate.
Now, a lot of these companies have different accounting valuations. For instance, Amazon doesn’t necessarily report earnings in the same way that Apple does. But this is a good, simple overview of the FAAMNG sector to show you where their P/Es are right now versus their three-year growth estimates.
And when you look at this, the cheapest one right now from a P/E perspective is Meta. It trades at about 17 times P/E.
The most expensive one is Amazon, which trades right around a 60 P/E multiple.
But what’s important here is where their P/E ratio is in relation to their growth. So, if their P/E ratio is below their growth, then the multiple has room to go and match it.
The P/E should be roughly around how quickly the company is growing because the P/E is basically a valuation on what investors expect the company’s earnings to grow in the future.
So, what’s really interesting is that from this perspective, Amazon and Apple look like the most overvalued because their P/Es are ahead of their growth rate, whereas Netflix, Microsoft, Google and Meta are all below it.
But what I find most interesting is that for Meta, after the sell-off on Thursday, there’s a huge, wide range between its P/E and its expected growth rate.
And I think investors are worried about some of the issues that Meta had in the last quarter, such as Apple’s new privacy laws, which stopped allowing Meta to collect data on users and then sell it to advertisers.
There’s also the emergence of TikTok as a competitor to Facebook. Instead of spending, you know, hours a day on Facebook, a lot of the younger generation is now using TikTok.
So, that’s caused the valuation of Meta to come in lower. The growth rate is still up, but I think investors are expecting this to fall a little bit. That’s why Meta is trading at a significant discount to where its growth rate is in comparison to the rest of the FAAMNG sector.
To give you the overview of this, I don’t think that the P/E ratios of FAAMNG is wildly overvalued because the S&P 500 Index is right around 23.
Meta is below the S&P 500 P/E ratio. Google is a little bit above it — same with Apple. Microsoft is about 10 points higher. Netflix is about 15 points higher. And then, of course, Amazon is two to three times higher.
But, you know, Amazon is growing very rapidly. If you look at its growth rate, it’s around 20% compound annual growth in its earnings.
So, that’s just an overview of where things stand for FAAMNG. I don’t think this is going to start a secular bear market in the space because of how quickly their earnings are still expected to grow in the future and how their valuations are significantly in line, for the most part, with the S&P 500.
So, that’s it for this week’s YouTube video. I want to thank everyone for tuning in. Any comments? Hit us up in the comments section. We’ll be sure to get back to you. And we’ll see you next week. Thank you.
Regards,

Editor, Strategic Fortunes
Morning Movers
From open till noon Eastern time.
Snap Inc. (NYSE: SNAP), the parent company of Snapchat, is up 49% this morning. The stock is on a rebound after being dragged down by the sell-off in social media stocks on Thursday despite Snap’s great earnings for Q4.
Bill.com Holdings Inc. (NYSE: BILL) provides cloud-based software that simplifies and automates back-office financial operations for small and midsize businesses. The stock jumped 30% after it provided better-than-expected guidance for 2022 when it reported Q2 earnings that beat estimates.
Sphere 3D Corp. (Nasdaq: ANY) is a data management company that is transitioning to cryptocurrency mining. It is up 21% on the news of a deal to acquire next-generation bitcoin mining equipment to expand its mining operations.
EGain Corp. (Nasdaq: EGAN) is a cloud platform provider of customer engagement automation solutions and services. It is up 21% after it reported record revenues and an earnings beat for Q2 driven by strong bookings in the quarter.
Aurora Innovation Inc. (Nasdaq: AUR) is a self-driving technology company that is up 18% this morning. The move came after e-commerce giant Amazon revealed its 5.2% stake in Aurora.
Unity Software Inc. (NYSE: U) provides software solutions to create, run and monetize interactive 2D and 3D content for smartphones, PCs, consoles and virtual reality devices. The stock is up 16% after it beat Wall Street’s Q4 estimates and raised guidance for 2022.
Standard Lithium Ltd. (NYSE: SLI) explores, develops and processes lithium brine properties. It is up 14% on a bounce from its drop on Thursday after short seller Hindenburg Research published a report alleging the company’s lithium extraction technology does not work.
Redbox Entertainment Inc. (Nasdaq: RDBX) operates a network of self-service kiosks where consumers can rent or purchase new-release DVDs and Blu-rays. It is up 13% on a rebound after crashing 50% on the news that its financial results were hurt more than expected by the lack of new movies in 2021.
Magnite Inc. (Nasdaq: MGNI) is an online advertising technology company. It is another stock that is up 13% on a rebound after dropping on Thursday along with social media and tech stocks.
Bit Digital Inc. (Nasdaq: BTBT) is a cryptocurrency miner that is up 12% this morning. It is climbing higher along with several other crypto-related stocks in response to a broader uptrend in the crypto markets.