Indicators pointed to a bear market for the past month. Momentum indicators and valuation warned of a potential decline.
Most important to me, breadth signaled a sell-off was likely, as I wrote in August.
Breadth indicators tell us how many stocks are participating in the broad trend. They count how many stocks are moving up or down.
That’s important because a bull market can only continue when most stocks are moving up. When too many stocks are declining, the bull market ends.
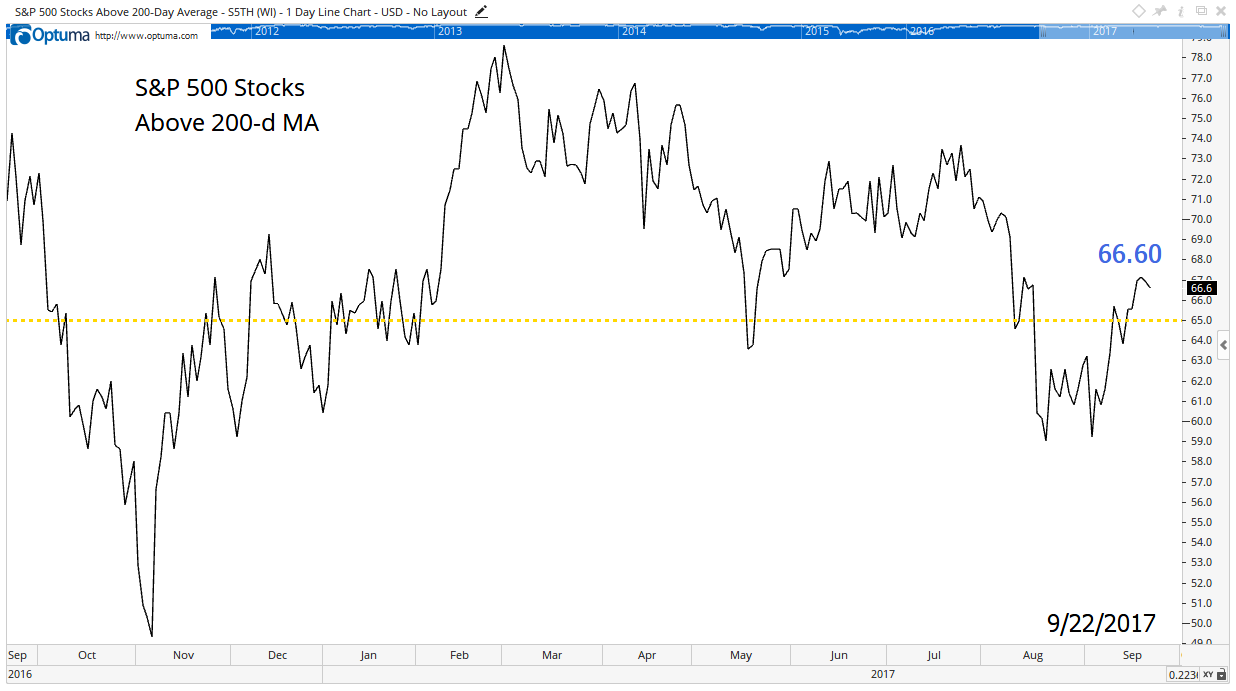
To monitor breadth, I like to watch the percentage of stocks trading above their 200-day moving average (MA). This tells us how many stocks are in long-term uptrends. The most recent chart is below.

The important level to watch is 65%. We have a bull market above that level. When less than 65% of the stocks in the S&P 500 Index are above their 200-day MA, the market usually declines.
Since August, breadth was bearish. But last week, the indicator crossed above that important 65% level.
Now, I spend a lot of time talking to old traders. They share wisdom from their decades of experience. Several told me: “The best signal is a failed signal.”
That means when a reliable indicator quickly reverses, we almost always see a big move. Well, we have a failed signal in this indicator. Breadth turned bullish after a brief dip into bearish territory.
It might turn down again, but it might not. All we know today is that we should expect a big price move.
For now, I’m switching camps. I’m a bull, at least until the indicator reverses again.
If the percentage of stocks above their 200-day MA falls below 65% and stays there for three days in a row, I’ll become a bear again.
Given the changing environment, I recommend focusing on the short term. Now is not the time to add to long-term holdings. Now is the time for short-term trades, like call options, that can deliver quick gains.
Regards,

Michael Carr, CMT
Editor, Peak Velocity Trader


