

Is it time to buy growth stocks?
As stocks surge in the way of a multiweek downturn, Ted Bauman and Clint Lee tell you why it might be safe to get back in the market and share their two favorite exchange-traded fund plays for cashing in on the market’s gains.
Click here to watch this week’s video or click on the image below:
Transcript
Ted:
Hello, everyone. It’s Ted Bauman here with Clint Lee with your Monday Your Money Matters. As a reminder, we’ve renamed our daily email and video output to Big Picture, Big Profits. And the reason for that is because that’s the theme of the Bauman Letter. And if you’re interested in subscribing to the Bauman Letter, you can click on the little icon up in the upper left hand corner. That’ll take you to a page where you can explore the offering and remember that it is money back guarantee for a year. So you can try it, if you don’t like it, you get your money back right up until last minute of the last hour of the last day of the year that you first tried to subscribe. We’re doing very well, actually, in the Bauman Letter. We recently decided to double down on some positions and my God, Clint, what a great decision that was.
Clint:
Been a good week.
Ted:
Hey, we saw a 45% jump in one of the positions that we just re-recommended just in the last week. It just blows my mind. And the big question, though, I think: Is this sustainable? Or is this just irrational exuberance version 2.0, first version being back in 2020, 2021. So one way to look at this is to look at what’s been happening, and before we start picking this apart, to look at what’s been happening to the kinds of stocks that are starting to make a bit of a rebound, at least at the 30,000 foot level.
Here’s a chart that shows what is called very cutely in this, the “techy sectors.”
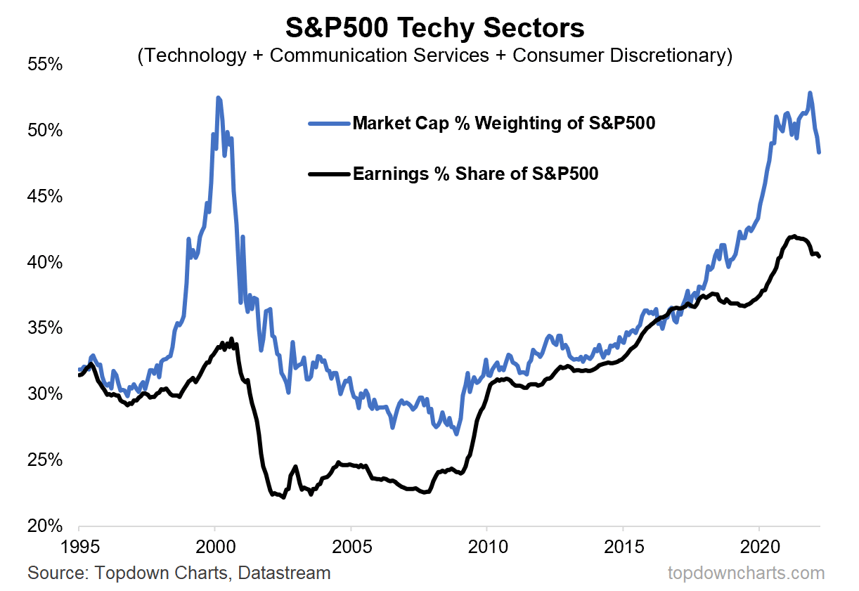
That’s technology plus communication services, plus consumer discretionary. And what it shows is the market-cap percentage as a weighting of the S&P 500, going back to the early ‘90s. And what’s clear here is that we are at levels that we’ve only seen before back in the dot-com period, when we had a massive upturn and then a big crash. That’s also the case, though, and more encouragingly that’s the case in terms of earnings. And I think that’s the critical point here, is that whereas the jump in stock prices in these so-called techy sectors back in the dot-com period was excessive relative to earnings, we’re now seeing really strong growth in earnings in these stocks. The question is, it strong enough to justify these increases? Second chart I want to show you is just the relative performance, going back a year, on four different categories:
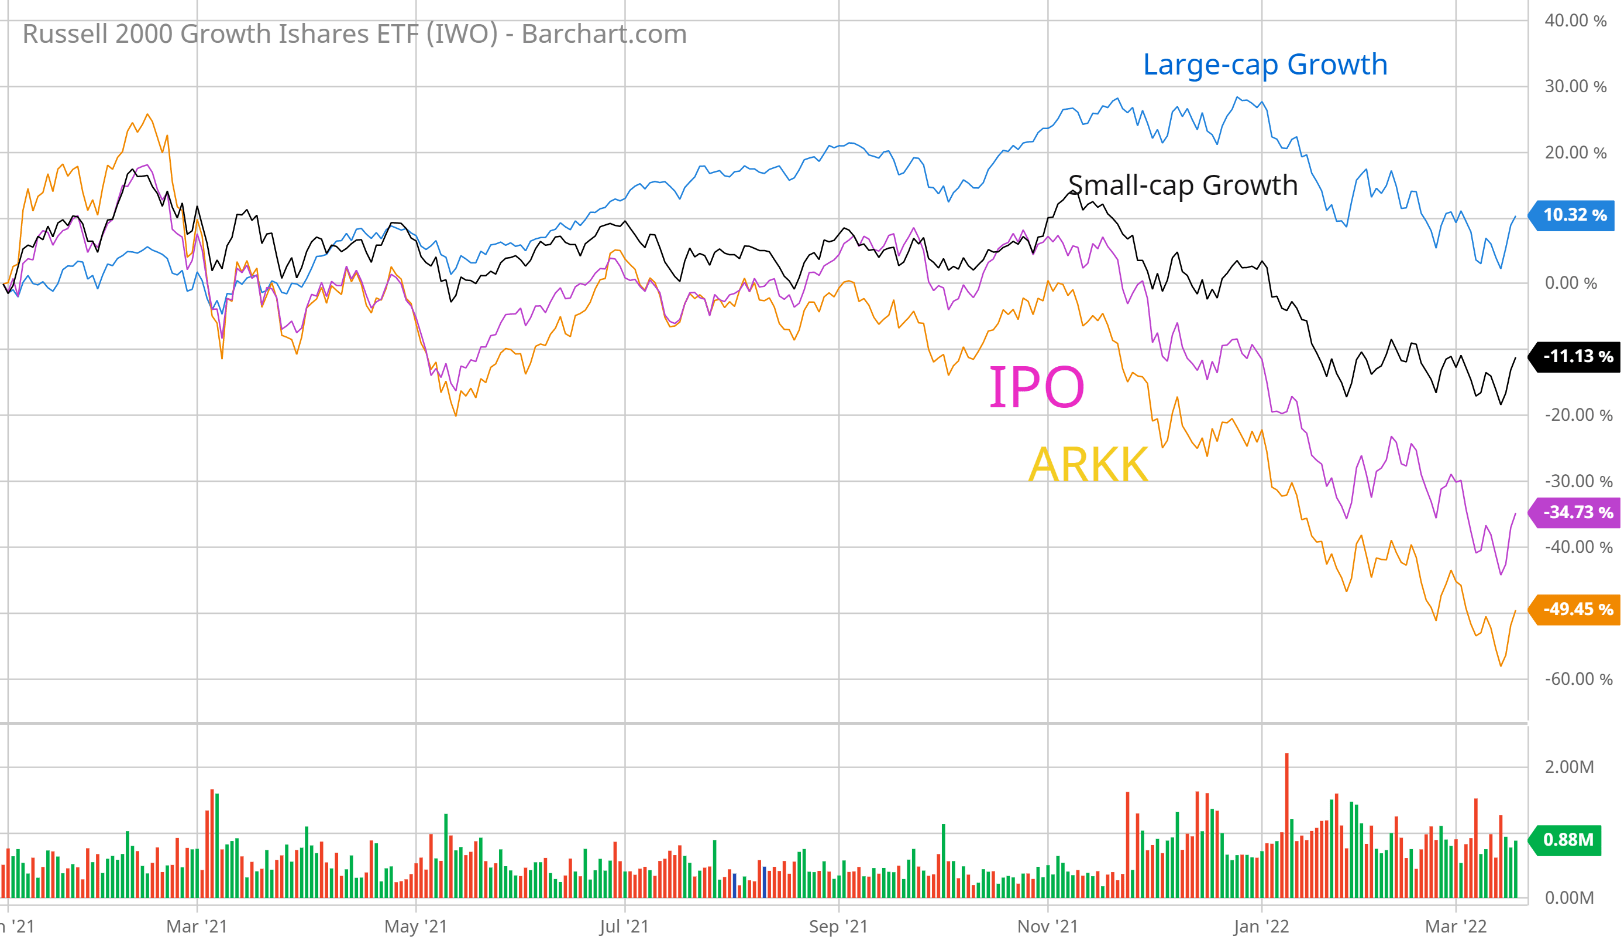
One is large-cap growth that would include the so-called FAANGs. I don’t know if we’re still calling them that, but basically that group of stocks, the big guys. Then we’ve got small cap growth, which is really in a sense where everybody’s been fishing for big gains, and that’s where we saw big gains back in late ’20, early ’21. And you can see if you look on the far left hand side, that it peaked around that point, and it’s now off by about 11%.
But the two big losers are the IPO, that IPO is an ETF that covers recently launched IPOs. And then ARKK of course is the famous company includes the great disruptive stocks of tomorrow. And those two are down by enormous percentages, much, much further down than small-cap growth as a whole, and obviously far much further down than large cap growth. Now you can see again that they’ve all ticked up in the last three trading sessions, but I just want to drill down a little bit. Here is ARKK:
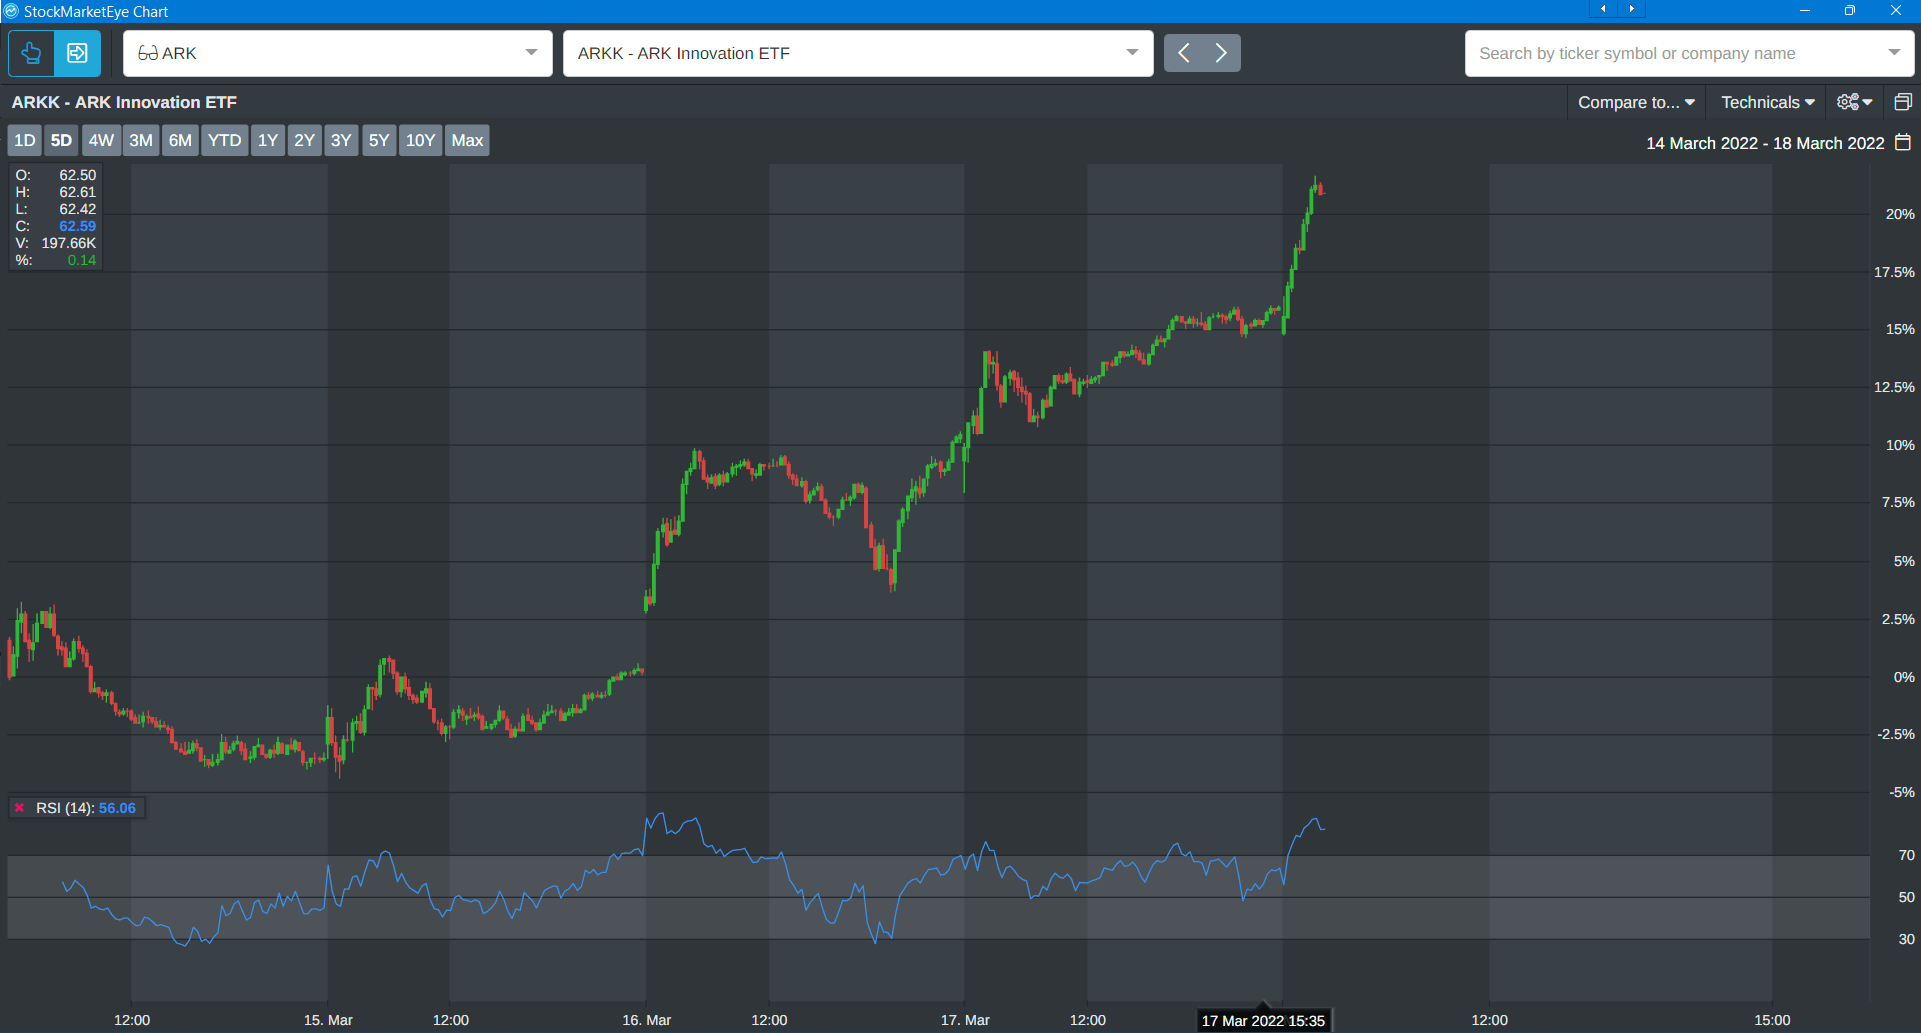
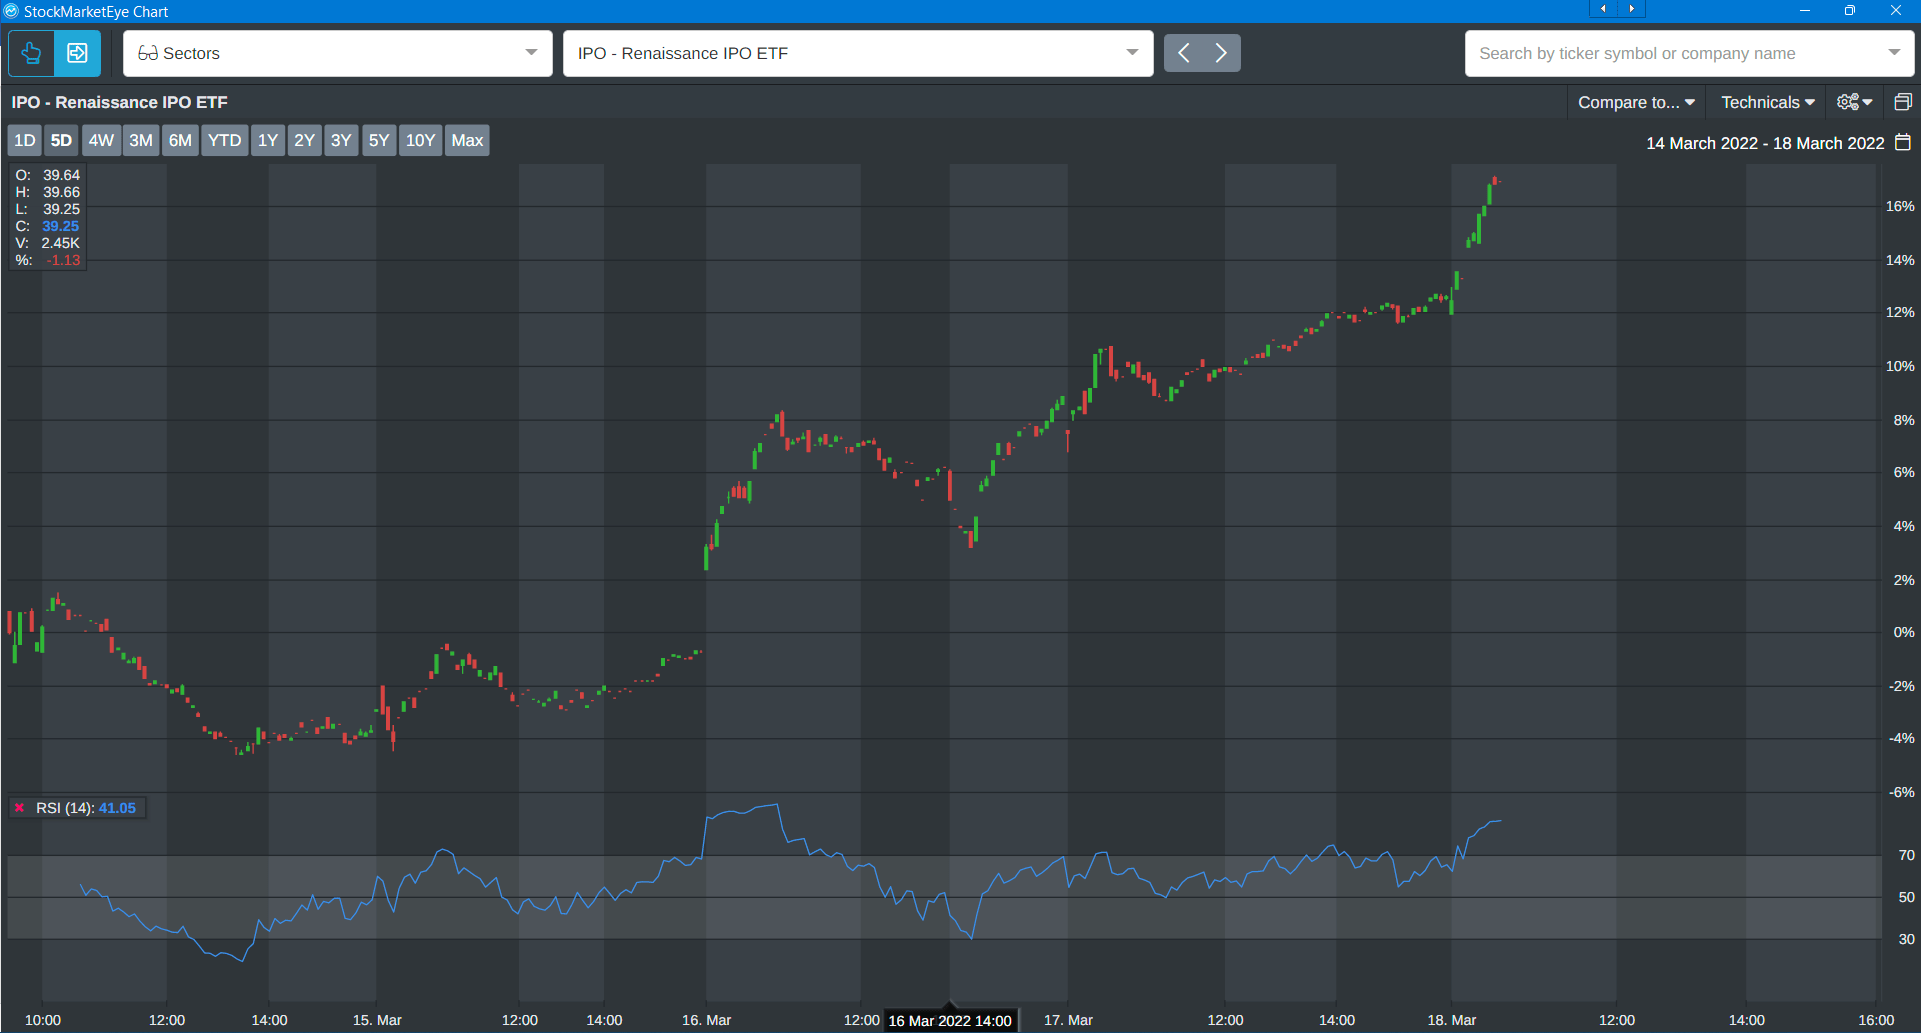
ARKK is up over 20% in the last five trading sessions. You can see from the Relative Strength Index (RSI) that it’s far in excess of the growth of the S&P 500 as a whole. And then of course IPO also up a little bit less, but over 16% around 17%:
So Clint, the question is: Is this irrational exuberance, or should our viewers and investors be more selective in choosing out of these stocks that are rising? And if so, how do you be more selective? What do you think?
Clint:
The answer is yes to all your questions.
Ted:
Oracle questions… Leading questions, right?
Clint:
There are. Yeah. Great leading questions. Yeah, there’s still irrational exuberance, but given the declines that you’ve highlighted in several ETFs, several style boxes, there are some opportunities for those who want to be selective. So I thought first, it’d be good to just take kind of a broader view of where are some relative value is starting to creep in. And so here’s a chart:
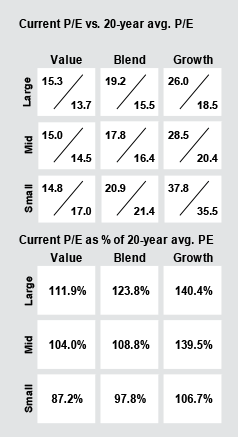
This shows the Morningstar-style boxes. So, nine style boxes of value blend growth across large, mid and small. And what this does is it looks at current valuations versus 20 year historic averages. So here’s that chart. The top panel shows you got two numbers in here, once again, that’s the current PE versus its 20-year average. But then if you look at the grid below that, and that starts to break it out, it takes a relative percentage of that figure. So large value is still trading at about 112% of its long-term average.
But what’s interesting is you kind of look across the top, and then you start to work your way down and you start to see those percentages drop, especially as you get more on the value blend side, but then especially as you get into smaller cap as well. And so one area I think is interesting, you were talking about this in the performance chart earlier, is small growth versus large growth. And look at the relative valuation premiums. You’ve got large growth still trading at a 140% premium versus small growth that’s still at a premium, but it’s at about 107%. So just the declines that we’ve seen, you’re starting to bring evaluations, especially in the small cap space, a little bit closer to those historic averages.
So we’re talking about growth. So why growth stocks? Well, the defining characteristics with growth stocks is sales growth. They usually put up much stronger sales growth numbers relative to value, but the drawback is valuation. But so why would you want to focus on the growth side of the equation? Well, this chart … it breaks down the sources of long-term stock performance:
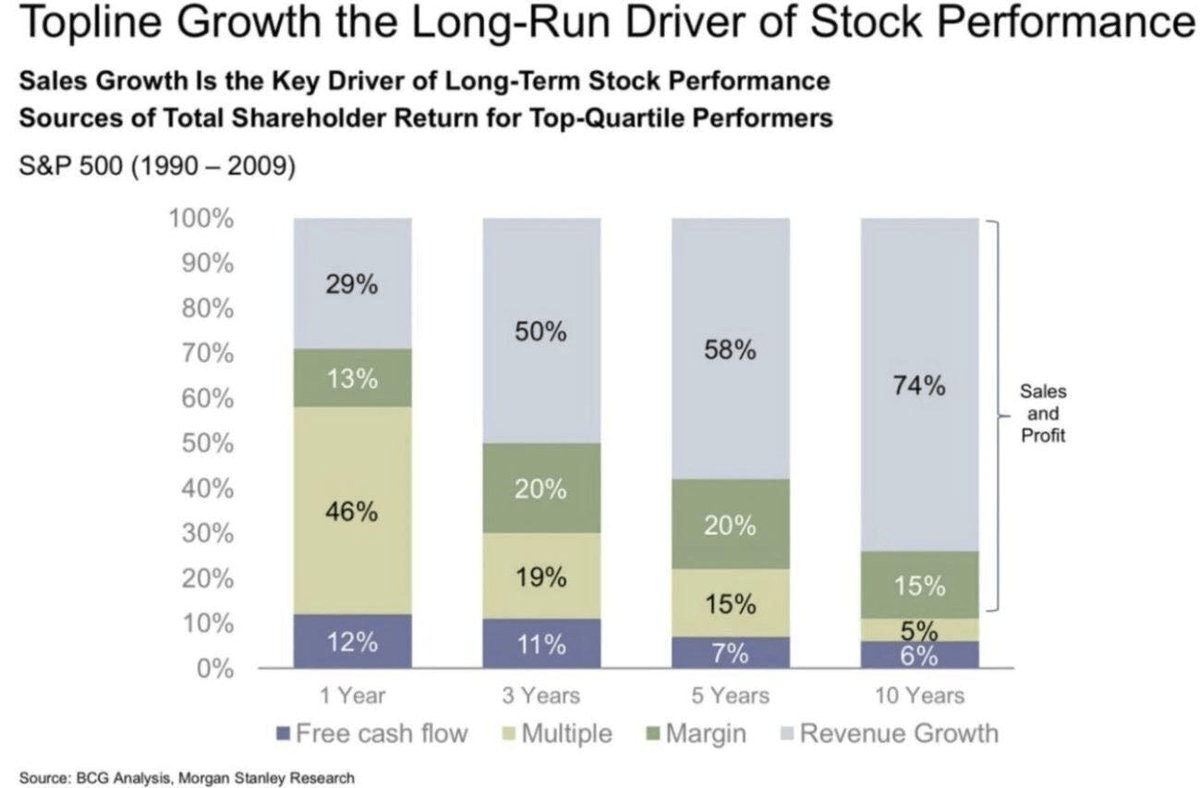
Now, I know that this chart goes only through 2009. It’s from 1990 to 2009, but I’ve got my own take, my own update on this I’ll show you in just a moment. But I think this is a powerful one explaining the long term drivers of stock performance. You look over a 10-year time frame on the right-hand side of this chart, and it shows that 74% of return in top-performing stocks comes from revenue growth. So once again, 74% of returns is attributable to revenue growth over these longer-term time frames.
Now, a big part of what’s helped stocks in that period and now has been falling interest rates, so that’s kind of the whole duration of cash flows, that it helps make longer-dated cash flows that occur out in the future look more attractive when we’re starting to see that reverse today. So one area that I think you got to look at when you’re looking at opportunities in growth, especially in small cap growth, is you want to start to look at those companies that are making that turn to profitability, and they’re on a quicker basis. And there’s a couple ways you can look at that. I mean, you can look at analyst revisions, look at revenue estimates for one or two years out, earnings projections, cash flow projections one or two years out. So that’s where the focus is going to need to be at, is on stocks with those growth characteristics, but that have that profitability component coming in as well.
And so, I mentioned I had an update to the chart I was showing earlier. So if we take specifically the small-cap stock universe, so if I take the Russell 2000, I made a model, it’s made up of things like EBITDA margin, gross margin, projected revenue growth. If you take and rank the Russell 2000 based on those factors, and look at the stocks that rank best on those characteristics. So I look specifically at the top 100 stocks re-ranked every month, this is a performance you get over the last 10 years:
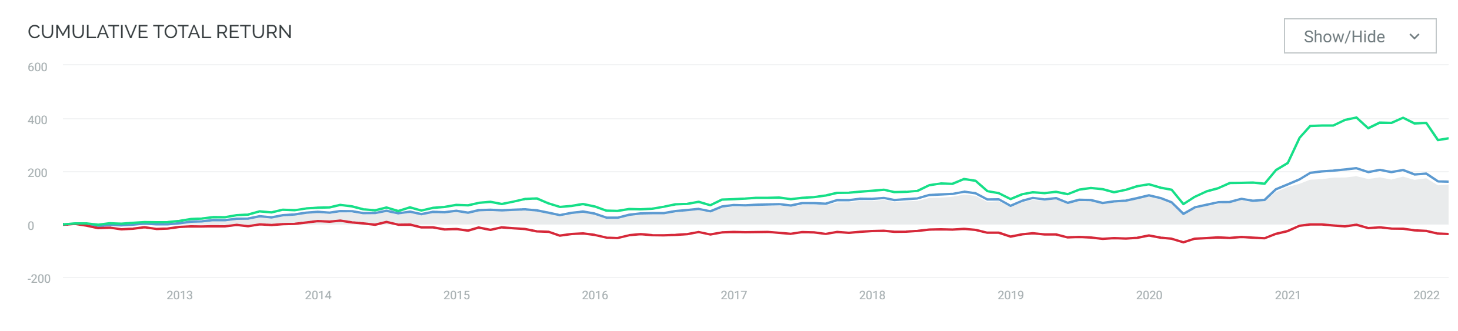
So the green line is those top 100 stocks. The blue line is the universe. The red line is the worst 100 stocks. So just showing that you can still get really strong outperformance looking at small caps, looking at the growth space, but I think what’s going to be important is to look at that profitability component.
And then the last thing I’ll mention as it pertains to all this is if you’re being selective, look at what’s happening in the world. Catalysts that can accelerate the potential of these companies. So just with the events going on in Europe, the focus, for instance, on clean energy, with inflation, costs rising, labor shortages, you can look at areas of automation. So I would use those catalysts to help be more selective in looking at opportunities in the growth space as well.
Ted:
So basically what you’re saying in a nutshell is that over the long term, what really counts is companies are growing their sales, which should be fairly obvious. But over the short term, what people get attracted to and what they throw their money at is multiple expansion. And that’s, if you go back to this chart again, the sources of total shareholder return:
In the short term, half of your gains are coming from margin expansion, or sorry, multiple expansion. But what that means is that you need to be able to call the top. And very few people are able to do that, and it’s a pretty dangerous game to try to play, right?
So if you really are committed to making money over the long term, then the thing to do is to figure out which of these stocks, which categories of stocks are likely to have strong tail winds, so that the big picture, the market environment, the total addressable market is growing like energy, clean energy, automation, et cetera, but also which companies are leading within that space. And so that’s what we try to do here at The Bauman Letter.
The other thing I just want to point out is that these things take time to unfold. And it’s critically important that you not freak out about specific stocks within this, either in a negative sense saying, well, I’m going to sell this because it’s down, or in a positive sense, oh boy, it’s up hugely so therefore all is forgiven.
Clint:
Thank you, I meant to make that point too, that you got to have a long-term mindset.
Ted:
That’s right.
Clint:
To step in right here with what these ETFs have done, what lot these stocks have done, if you’re buying these, if you’re evaluating these, you’ve got to take the long term investor mindset. You’re not the short term tactical trading opportunities.
Ted:
Correct. And then, and average in, look for down days, buy on down days, that sort of stuff. Well, I’ve got a recommendation that I think fits the bill. And as always when we make ETF recommendations, we would encourage you to go and look at the holdings of these ETFs to see which stocks amongst them are performing the best. Mine is the First Trust Dow Jones International Internet ETF. And I like it because I believe that there’s still a long way to go in bringing of the world up to the kind of levels of usefulness of the internet and the worldwide web that we’ve seen in advanced countries, particularly e-commerce, but also other things, just the kind of things that people are starting to use, like the internet of things, all this. As this stuff migrates out throughout the world, it’s going to become more profitable. These non-US companies, or rather companies that maybe are active in the developing world, emerging markets. Here’s a chart of that ETF:
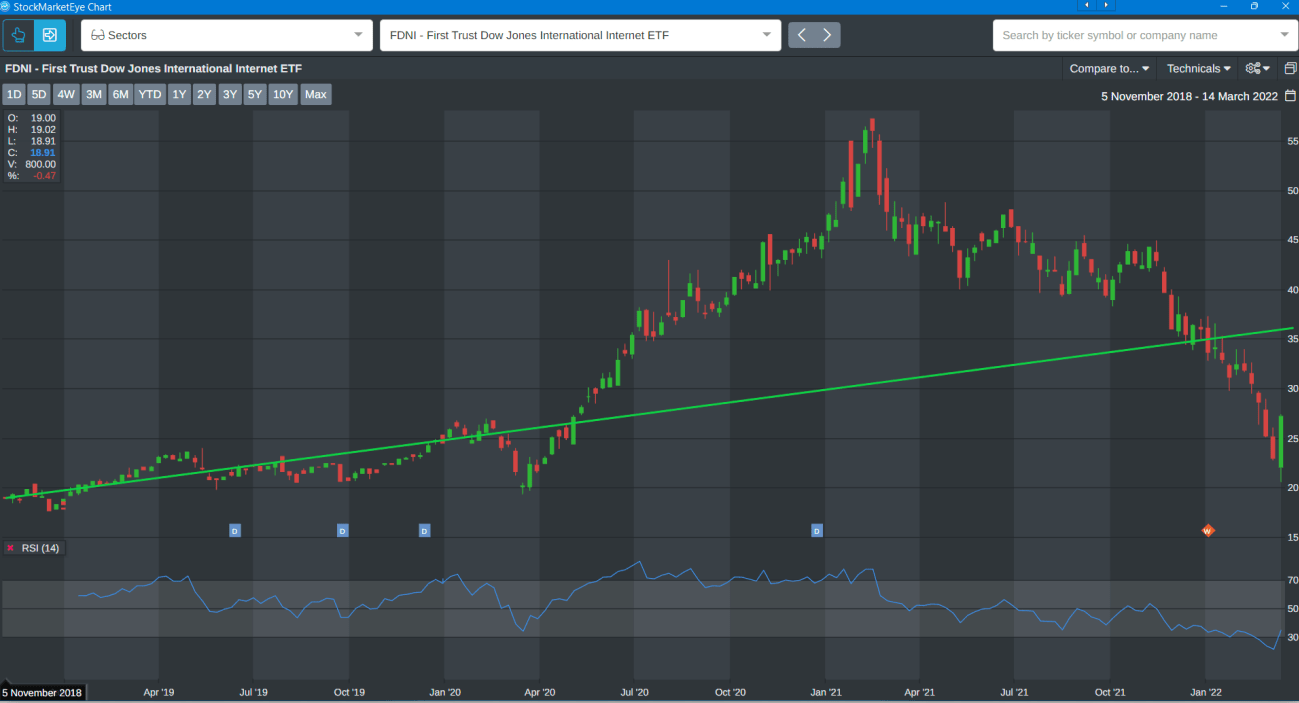
And I just want to use it to illustrate the general point here. You can see that the ETF just got to ridiculously high valuations in early 2021, just like everything else. It tried to recover, and then it’s fallen back down again. But I’ve also drawn a long term trend line going back to before the COVID and before the crisis, just to show you that in terms of a long term trend line of where this industry has been going, we’re actually well below that trend line now. And that’s what you want to look for. It’s oversold, basically. There are companies in this ETF that deserve to be in your portfolio, and right now if you were to them, you’d look at the gain potentially that you see in the gap between where they are now and where that trend line crosses the right hand access.
Now that’s not an infallible way of doing this, but it just goes to show you that exuberance can work in both directions, on the upside and the downside. And what we’re saying today is that we’ve reached the point where for specific stocks, anti-exuberance has become too much. So what have you got for us, Clint?
Clint:
I would stick with the clean energy theme. So here’s a chart of QCLN, it’s a clean energy ETF:
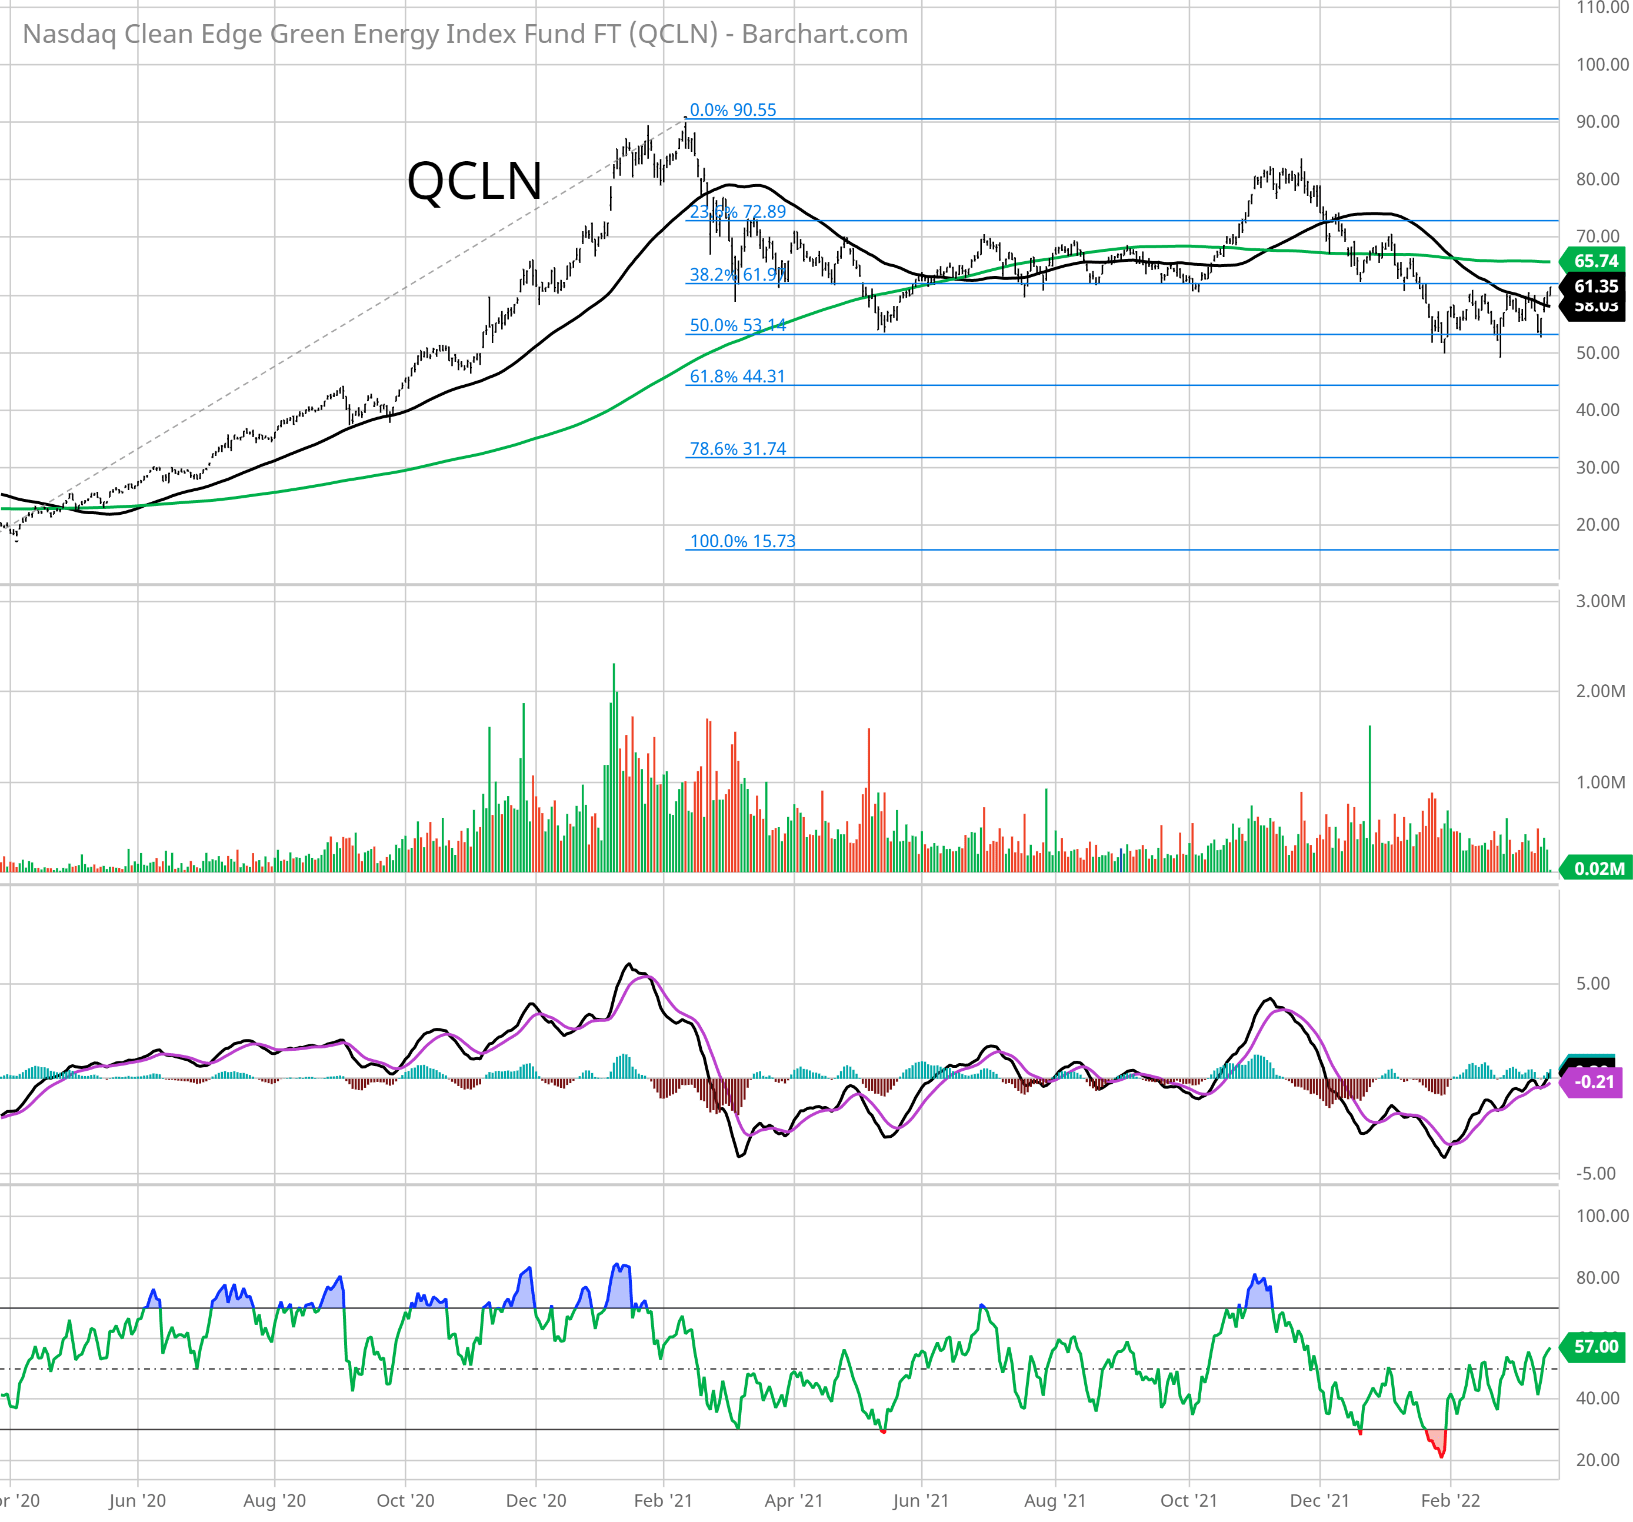
So, a couple things I want to show on here. This goes back to the start of 2020, and you’ve got the really big initial run up in this ETF. And I’ve drawn, for those interested, retracement levels of that gain. And so right now there’s a couple key retracement levels you can look at that oftentimes serve as good support. And we are seeing that right now with this 50% retracement. So if you look at these retracement levels, you get that 50%. That blue line coming across, how we’ve hit that here recently about three different times, so that’s served as good support. We’re back above that black line, which is the 50-day moving average.
And so, this is one where there’s a lot of more reasonable valuations in the clean energy space here as well when you’re looking at enterprise value to sales, or price to sales ratios, a lot cheaper than some of the other growth areas of the market as well, along with these catalysts in place, most recently the heightened focus on making that transition to clean energy, given what’s been happening in Europe.
Ted:
Right. So there you have it, folks, and those are just two examples. But the critical thing is, just to recap, that you start by identifying sectors with secular tailwinds, regardless of what’s happening in the economy, clean energy, internet and so on.
And then you look for the stocks within them that have rapid growth in sales and profit, because in that chart that we showed you earlier, it’s also the growth of profit, I think, that’s the critical thing. Because it’s a lot of companies grow their sales without growing their profit, because they’re deliberately doing that. I mean, Uber and Lyft are case in points, so don’t forget profit. That’s really important, because those kinds of stocks do well when margins are expanding, but not well, or sorry, when multiples are expanding, but not when multiples are contracting. And that’s exactly what we’re seeing right now.
So that’s our message for this week, folks. We’ll talk to you again next week. Have a good one.
Good investing,

Angela Jirau
Publisher, The Bauman Letter