While investors struggle to stay afloat in 2022, my Endless Income portfolio is one of the few strategies showing a positive return.
The secret is simple, we take advantage of ALL the best gains the market has to offer.
Meanwhile, most investors are missing out on a whopping 86% of potential gains. What are these people thinking?
Click here to watch this week’s video or click on the image below:
Transcript
Hello everyone. It’s Ted Bauman here, editor of Big Picture, Big Profits, and of The Bauman Letter. Before you do anything else, I want you to look at the description under this video and click on the link down there, and it’ll take you to an offer. It’ll either be for one of my products or one of my colleague Clint Lee’s products, but basically they are a link that’ll take you to being able to take action on some of the proposals, and some of the offers and the ideas that I present here. And I’m going to show you that as bad as things have been, some of what we’ve been doing have done very, very well even during this time of crisis.
Now, before I get to the content of that, you see that box back there sitting on the chair next to the door here in my office in Cape Town? Well, it’s full of these. This is something I found under the stairs when I came here in June. It’s a box of CDs from a band that I was in called “Woodshed” back in the 1990s and 2000s here in South Africa that was at one point in the top 10 on the radio charts. So just reminds me that as bad as things can be in the economy, there’s always good stuff to be happening in life, and then discovering a little gold mine like that is one of them for me. Anyway, this week I want to talk about dividends. I’m going to do that in the context of this:
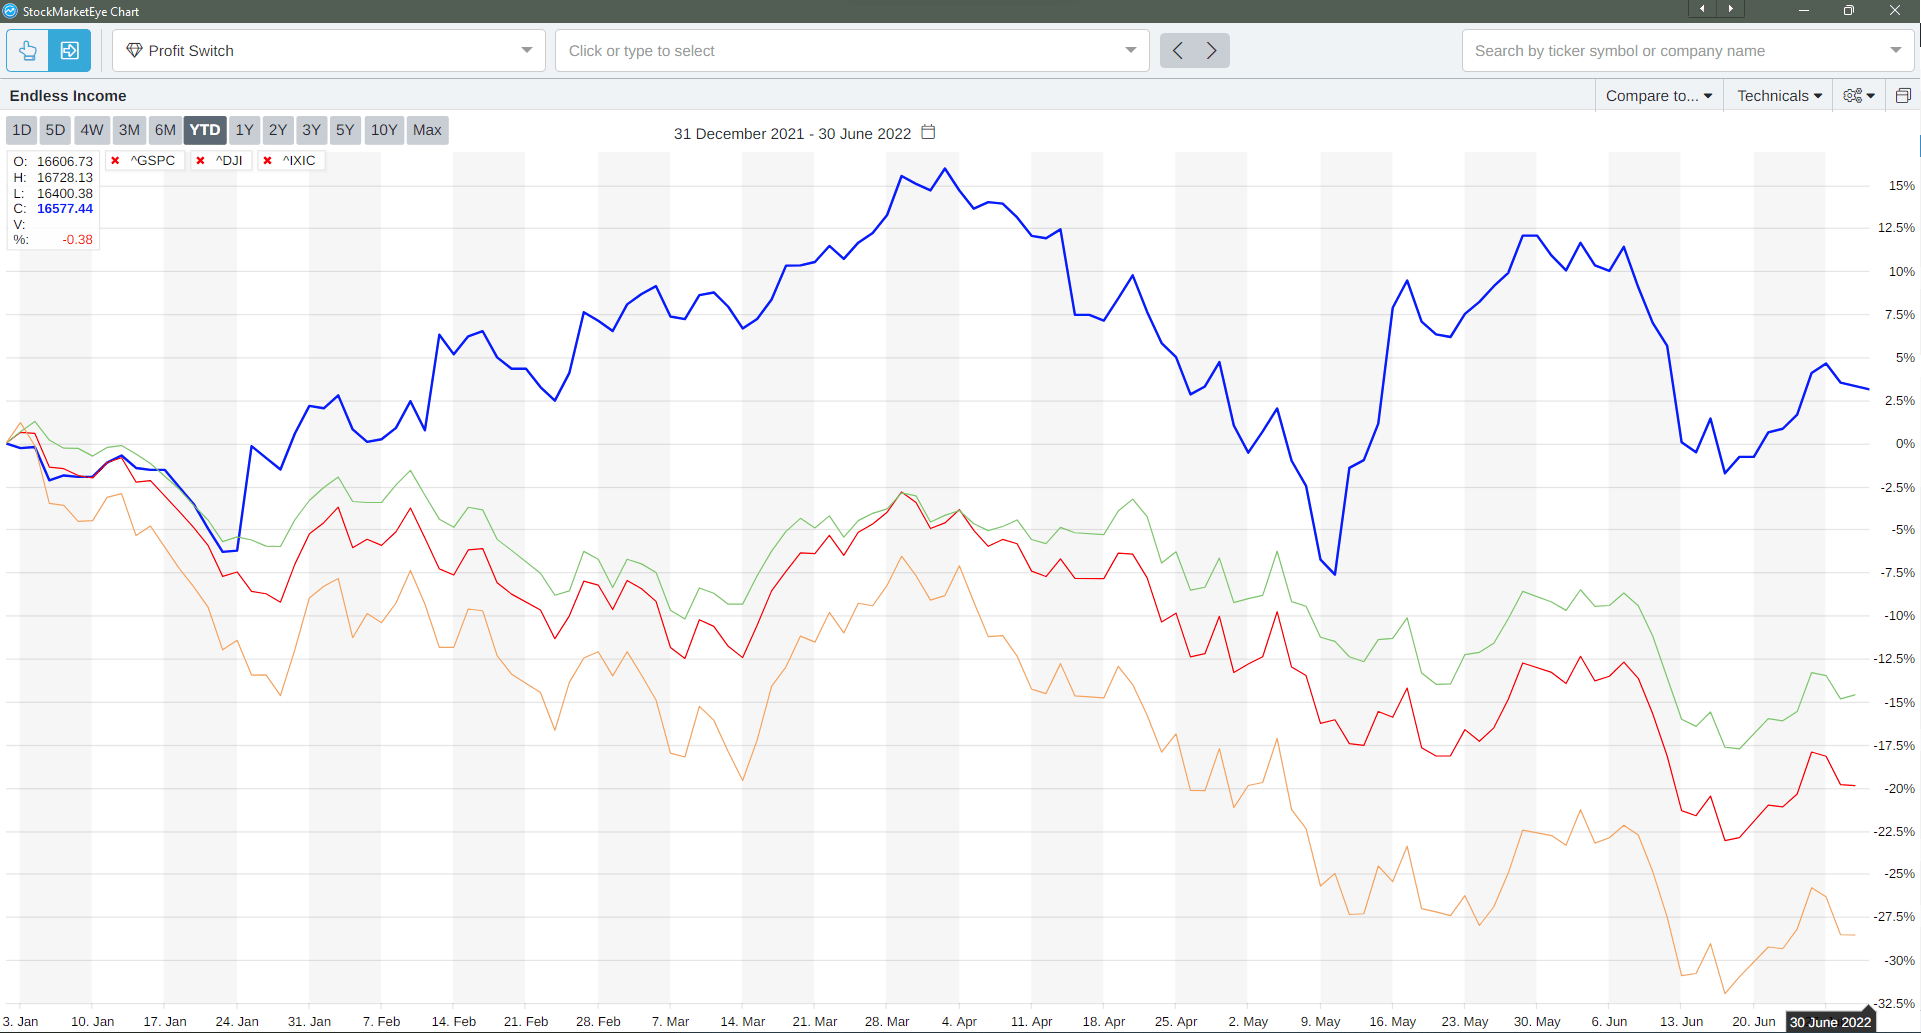
Here’s the chart that shows basically the performance of the major indices. You’ve got the Dow in green. You’ve got the Nasdaq in orange. You’ve got the S&P 500 in red, but then you’ve got a blue line up there. What’s that blue line? You’re probably asking yourself. Well, that blue line is my portfolio, the Endless Income portfolio. It’s the dividend portfolio that I offer as part of The Bauman Letter.
Now, as you can see, it’s up a bit this year, but it’s significantly above the rest of the market. And my message for you today, folks, is that if you want to be able to survive in what’s coming, looks increasing and like we’re heading for a recession. I’ve learned to take bad news as the most likely outcome after the last year or so. You want to be invested in something like my Endless Income portfolio. Now, just to show you why. Now, here’s a little chart that shows some of the picks in my portfolio, it’s not all of them, but notice that there are three columns:
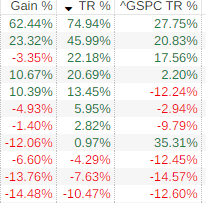
So, one is gain, that’s just the stock price. One is total return, that’s the stock price plus dividends and then there’s the S&P 500. And just look at what the difference can be, the dividends can make. One pick there, we’ve made about 62 and a half percent on the price, but we’ve made 75% almost on our total return. The difference, folks, is dividends. And if you notice that total return is absolutely blowing the market away, that’s over the same time period. You go down the list, you even find that some of the stocks are in negative territory, some of them are more recent picks. But the key thing is that when you throw in the dividends, you notice that there’s a big difference.
For example, one is down about 13.8%, but on a total return basis. We’re down only seven and half percent, which is less than half of the downward movement in the S&P 500 during the same period. Now, dividends, did you know that only 14% of the money ever made in the stock market came from price appreciation? The other 84% came from dividend payments. That’s right. Over the length of time that the U.S. stock market has existed, only 14%, 84% of it has come from dividends. For every $100 anybody’s ever made in the stock market, 84 of those dollars came from dividends.
Now, one of the great things about dividends is that I’m going to talk about why I love dividends so much, but let’s just look at a chart that shows what happens over time. Here is a chart that shows a hypothetical $100 invested in dividends going back to the 1930s.
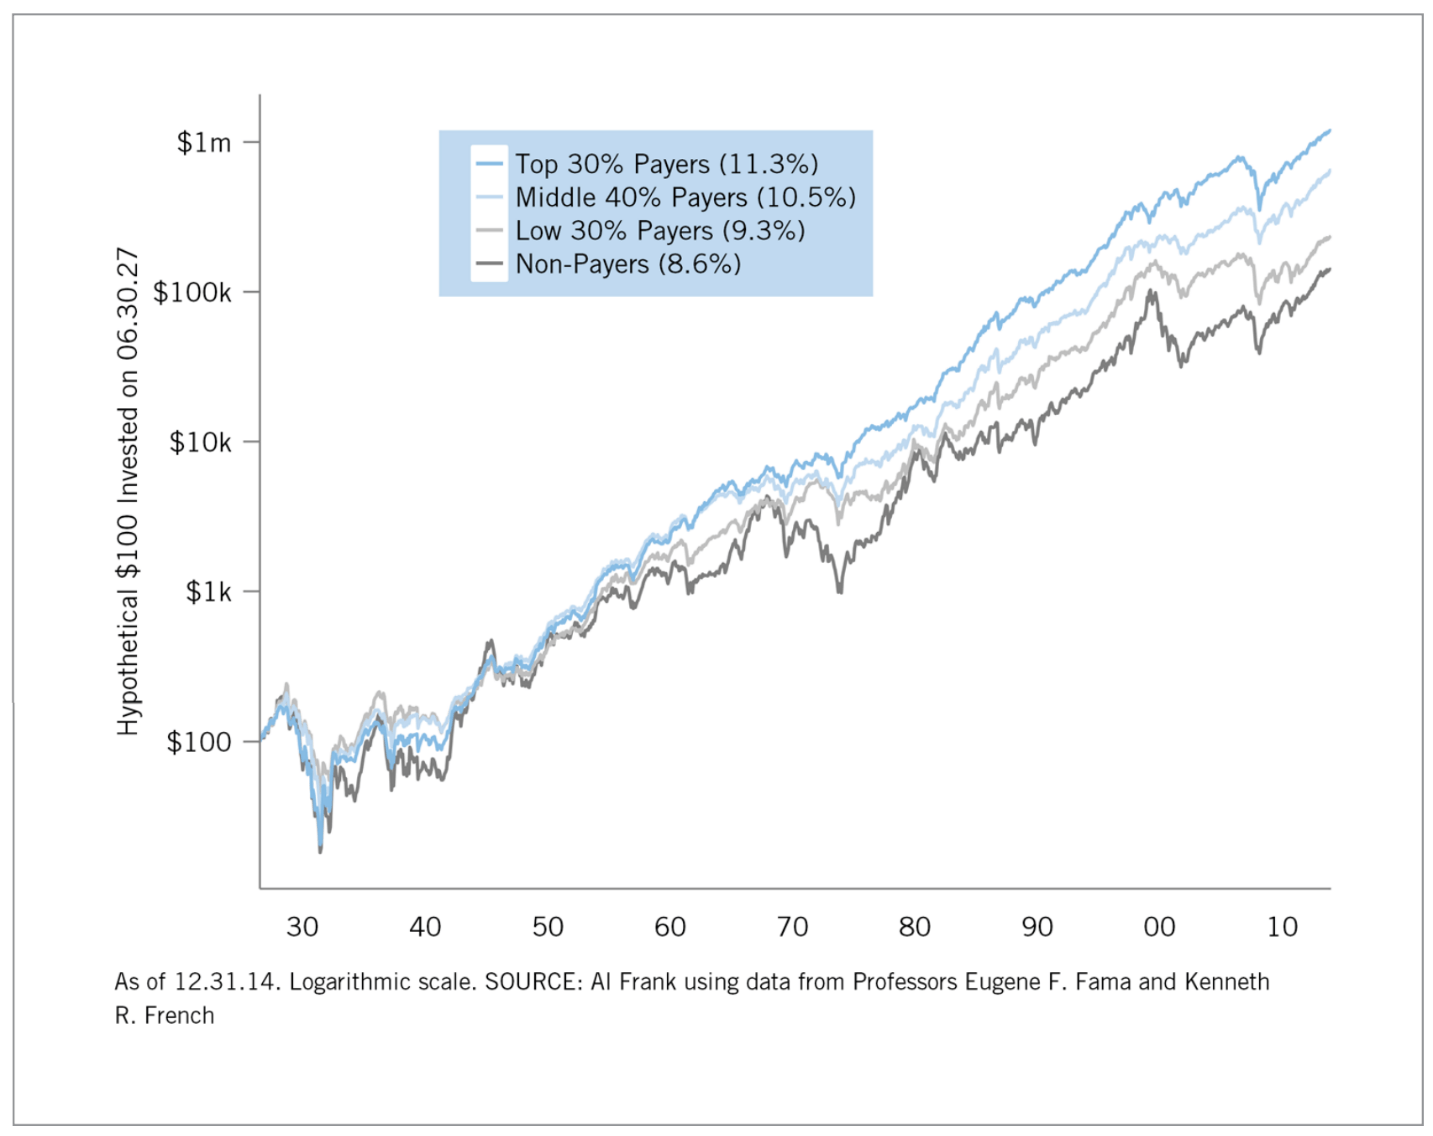
And this goes up into the early 2010s. The average annualized return on the top 30% of dividend payers is about 11% per annum. The middle 40%, around 10 and a half percent. The low 30%, in other words, the companies that pay in the low dividend tier that’s about 9%, that’s pretty good. But non-dividend payers, the average annual gains only 8.6. So the key thing here folks is that dividend payers, especially good ones are the long-term source of big gains.
Now, that’s not the only reason I like dividends. I also like them because they are great in troubled times. Here’s a chart that shows basically the contribution to total return that came from price during various decades, as well as dividends:
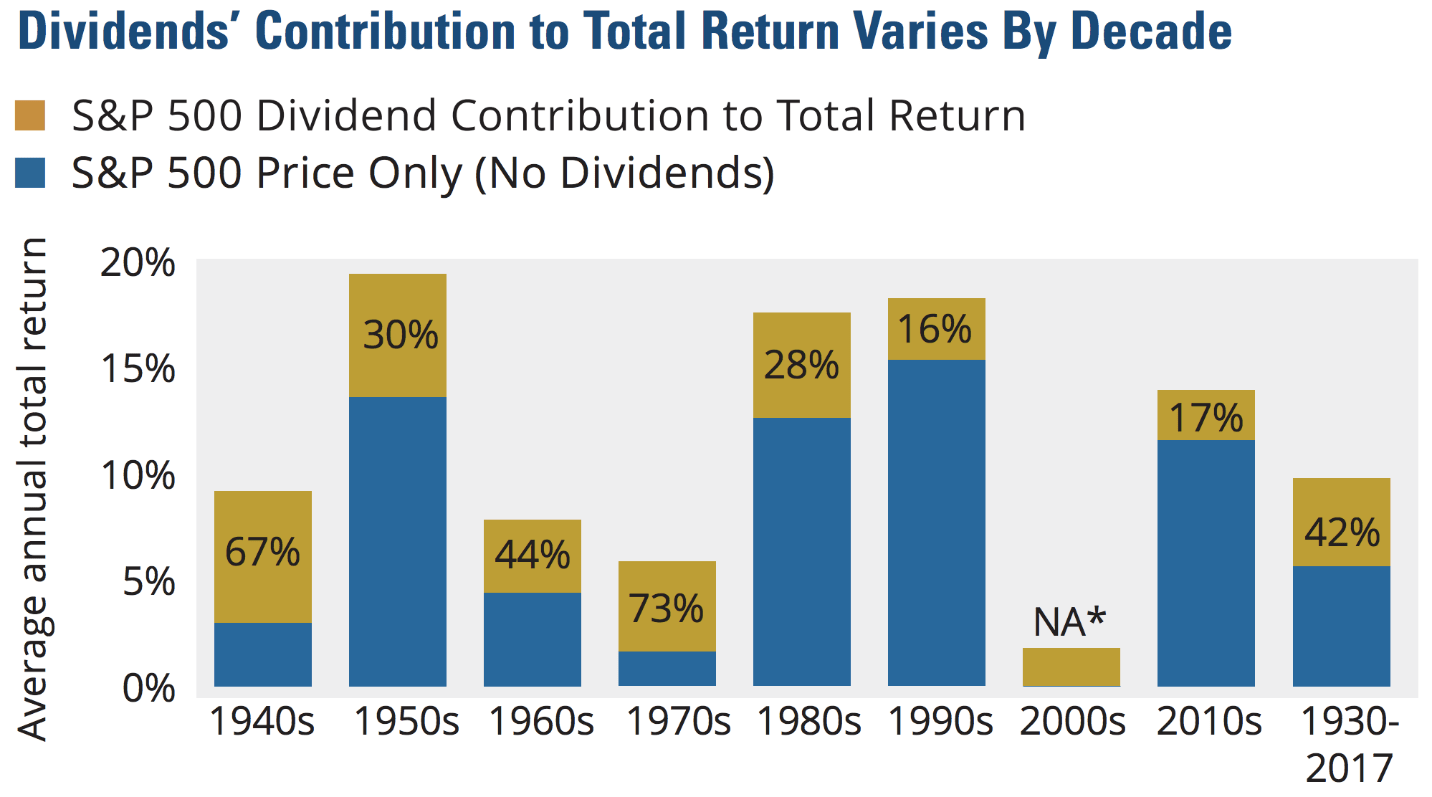
The critical thing to note here is during the 1970s, the time when inflation was a big problem, 73% of your gains in the stock market came from dividends. And during the entire period from 1930 to 2017, which is obviously before the COVID crisis and all that big run-up so I take that, but the critical thing is that 42% of your gains came from dividends during that period. So what that tells you is that if we’re heading into a period like the 1970s or even the 1980s when dividends gave you about $1 out of every three that you earn in the stock market, it’s still a good thing to be invested in. Now, here’s a chart that shows that dividends are also safer, rather dividend payers are safer and less volatile:
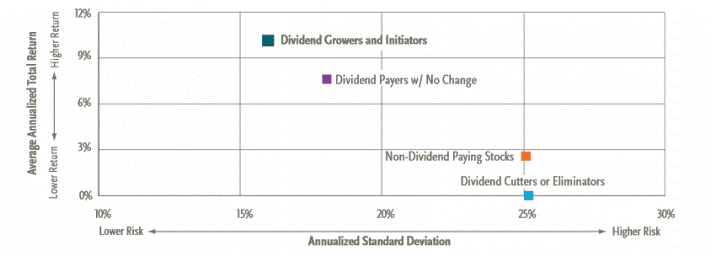
This chart shows the average annualized total return from different categories of companies and then on the bottom, the annualized standard deviation. That’s how far those companies vary from the market as a whole (i.e., the S&P 500). At the very top, the highest gainers and the less volatile, the least volatile are companies that grow their dividends over time. The second highest are companies that maintain steady dividends, and then the lowest ones are the non-dividend paying stocks and even lower than that, companies that cut or eliminate dividends because when that happens, that means that companies pretty much on its way to oblivion.
So the point here is that if we are in a difficult situation like the 1970s, where do you want to be, folks? You want to be in dividend growers like the companies that I have in my Endless Income portfolio. And one of the reasons for that is because of what happens with dividends and inflation. Here is a chart that shows basically the total number of dividends, where the amount of dividends paid out. This is in billions of dollars during the various decades going back to the 1950s:
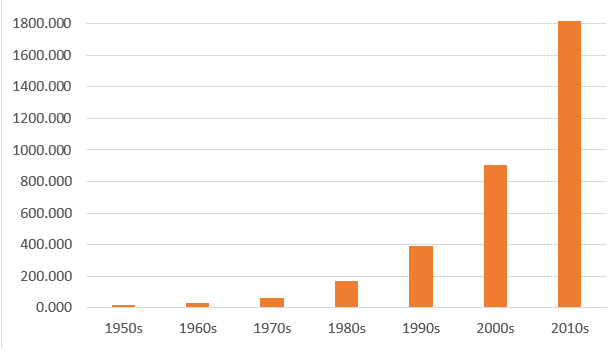
Now, the critical message here is that while the inflation, if you want to call it that has basically increased by over 1,000% since the 1950s, dividend payouts have increased by nearly 12,000%. In other words, dividend payouts have increased by 12 times more than inflation since the 1950s. And this chart shows you the total quantum of dividends paid out and it’s just magnificent. Now, you know who else likes dividends? Warren Buffett.
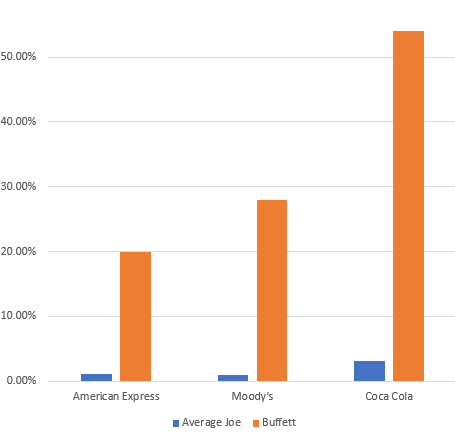
Here’s a chart that shows if you just held the stock of three companies that are core to old Warren’s portfolio at Berkshire Hathaway, American Express, Moody’s and Coca-Cola, that’s the returns you would’ve got. But if you take Buffet’s practice of reinvesting his dividends over time and holding them over time, look at what happens to the returns, folks. You make big money when you earn dividends and plow them back into your stocks. Here’s Coke broken out since the late ’70s when Buffett first bought it and look at the difference:
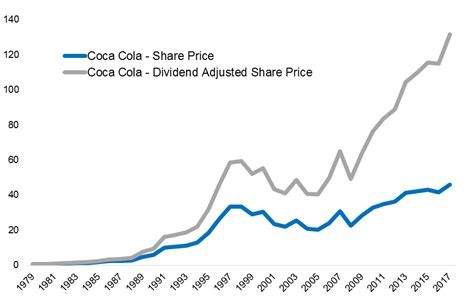
Look at the share price versus the share price that includes dividend. In other words, if you include the dividend as part of your return, it’s actually total return really. It’s just there’s no comparison. Now, why does that happen? Well, it’s something called compounding. Albert Einstein actually broke it out and mentioned that compounding was probably one of the greatest forces in the universe.
What’s compounding? Well, it’s when you get a dividend and then you have that dividend automatically reinvested in more shares of the same company. So the next time you get the dividend, you’re going to be getting dividends on your previous dividends as well. Now, if you know your math, you know that over time that turns exponential. Here’s a chart that shows the potential growth of just dividends for a hypothetical investment of about $1,000, over the period of 40 years, just the dividends themselves.
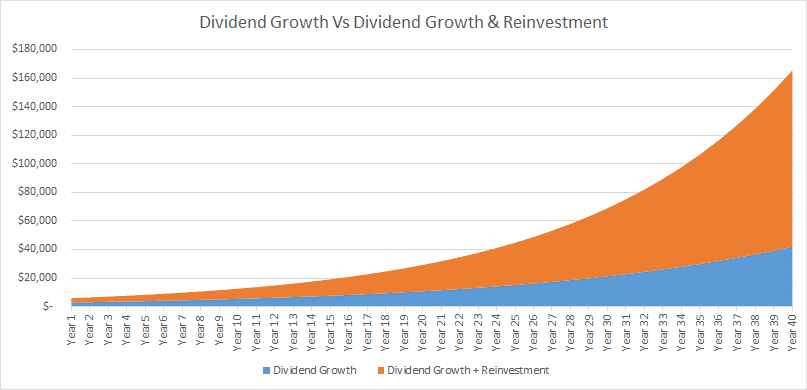
Sure, they grow. They grow over time. But look, what happens if the dividends are reinvested over that period. That’s basically the value of your holding. It goes from a $1,000 to $160,000 in 40 years. Which, of course, if you’re like me and close to retirement, may not be such great news now. But if you’re young, folks, put away that bitcoin, folks. Look at this chart and go looking at the dividend pairs I’ve got in my portfolio. Now, here’s another chart that looks at something similar, but this is the S&P 500 in blue and then the S&P 500 with dividends reinvested:
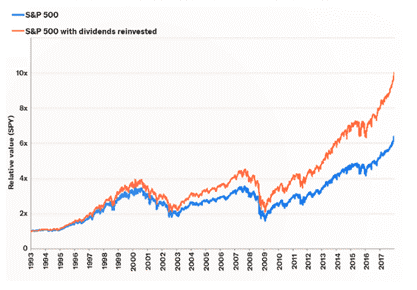
And this takes us back to the early ’90s. And again, it’s just there’s no comparison. You get a little bit over 6% return on the S&P, you get 10 times your return if you take the dividends and reinvest them. And remember, most of the companies in the S&P five and don’t pay dividends. So this is just the ones that do. Now, what that chart gave us, the actual figures are the average annual returns for dividend payers over time, assuming of 5% growth in the dividend payout every year is that over 10 years you get an average return of about 15.5% on your investment. Extend that out to 15 years, you’re getting almost 20% annual average gains. Remember, that’s the effect of the compounding. Over 20 years, you’re up to 26%. Over 25 years, you’re up to nearly 35% annual. We’re talking annual average gains.
So what’s happening is that you get huge gains later on that give you these big overall gains on an annual basis. Now, remember one of the reasons why dividends are so great is because they’re irreversible. Once they’re paid out, they’re yours, nobody can take them back. Now, if you own a stock that doesn’t pay a dividend, the only way you can earn a return is through share price appreciation and then selling it when it’s up, which is a very difficult thing to call, right? Calling tops.
So let’s say you bought Google, which pays no dividend at all. Well, the company grows and the share price rises with it, but let’s say you need to sell part of your stock at a time when the market’s down, when the stock price has fallen. Well, you can lose five- or 10-years’ worth of accumulated share price gains if you’re forced to sell, let’s say for a medical emergency or required minimum distributions from your retirement funds, whatever it may be. If you’re only relying on stock price appreciation, you are increasing your risk dramatically.
Now, on the other hand, a quality dividend growth stock, a stock that is growing its dividends, the kinds that I tend to look for can give you with a rising income from your investment, no matter what happens. And then, of course, you can reinvest that back into more shares of that same dividend giving you that exponential growing income stream. And even if you stop reinvesting, you still got the money. In other words, dividends are yours, you accrue them. They’re tangible, permanent benefits that nobody can ever take away from you. And even if the market crashes, that’s great, buy more of those dividends because what we’ve seen so far this year like with my dividend-paying stocks, a lot of them have been dragged down by the rest of the market.
Because even good companies get dragged down when the index goes down or when people sell ETFs and passive investing, it pulls everybody down. So what I do? I buy more, that lowers my yield on cost or rather raises my yield on cost because it lowers my cost basis. So if we have a big crash, what do you do? Take some of the money that you manage to squirrel away, you are doing that right now. You’re trying to squirrel away some money when we can buy the dip, but buy the dip in dividends. I think that’s going to be the way of the future.
Now, let’s take three examples:
UnitedHealth Group (NYSE: UNH) — If you’d invested $10,000 in UnitedHealth back in 2002, you’d now be getting a yield on cost of 102%, 102% every year. In other words, on the initial investment of $10,000, you’d now be getting $10,200 in dividends every year, every year, not just in total, every year. And at the same time, this stock price has gone up 9000% since then. So people who think dividend stocks don’t grow. Well, there’s your answer, right? That’s only 2002, that’s only 20 years ago.
Medifast (NYSE: MED) — The company that makes those health shakes and things like that. Their annual yield is now 420%. So if you bought $10,000 worth of their stock 20 years ago, you’d now be getting $42,000 a year on the basis of that investment. So basically you’d be absolutely going nuts with your dividends. Right now, you’re basically getting an annual dividend of $5 and 68% whereas you paid a $1.33 for the stock when you bought it. So that just shows you the power of not just dividends, but also share price increases because Medifast has gone up by 24000% in the last 20 years.
Tractor Supply Company (Nasdaq: TSCO) — A great company that sells stuff for backyard farmers and anybody who’s a DIY type. Their yield on cost is 418%. So if you basically bought $10,000 worth of their shares 20 years ago, you’re now getting $41,800 in dividends every single year. And at the same time, the stock price is up 53,000% in those 20 years. Now, let’s just put that in perspective, Amazon, which doesn’t pay a dividend is only up 23000% since 2002. Yeah, 23,000 is a lot, but these other companies are up a lot higher, and that one of the reasons they’re up a lot higher is because of their dividends.
They’re what I call buy low yield, high stocks and that’s what I think you should be focusing on. If you can get the kind of returns you’re getting on price from these stocks, because remember smart investors know what I’m talking about. They will go and buy these stocks as the market gets weaker. We’re going to see a big shift into some of these stocks now, even though they’ve been beaten down and the smart money gets into them before everybody else realizes that they are the game in town.
So I’m going to be talking about dividends again next week because I have something special for you. I have super dividends. I have dividends that are even bigger than the normal dividends that I’ve just showed you and I’m going to show you how you can get them next week, so make sure you turn in next Friday as well.
Ted Bauman signing off here in Cape Town, South Africa. I will see you again.
Kind regards,
Ted Bauman
Editor, The Bauman Letter