
I’ve been bullish all year.
And many of you have asked what makes me stay that way, considering dire warnings from many investors and market watchers.
Well, it all comes down to this chart of the S&P 500 Index that I look at daily.
I have showed it before, and I use it to determine trends in the overall market.
It’s why I stayed bullish earlier this year when the market was in correction mode.
It’s also why I am extremely bullish right now.
Because this key chart says there’s more good times to come.
Let me explain.
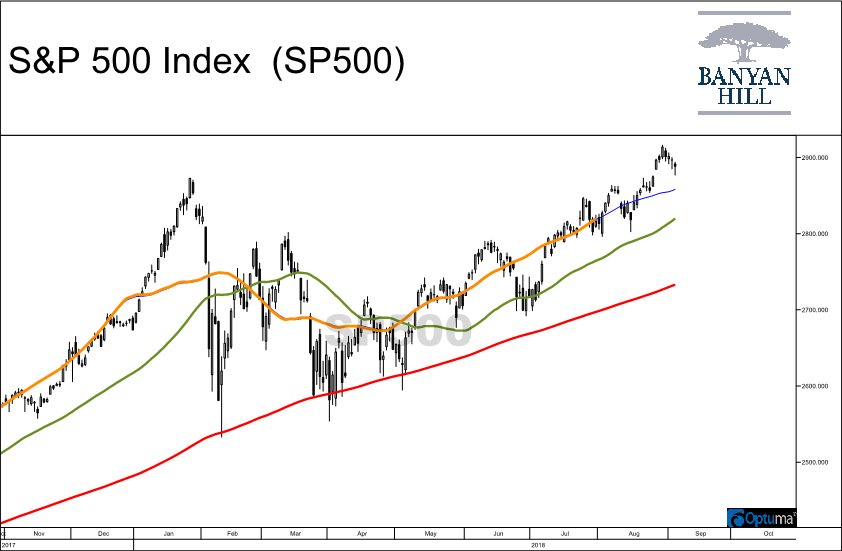
The black lines are a candlestick chart of the S&P 500 starting in November of last year.
What I want you to pay attention to, though, are those colorful lines.
The red line is the 200-day moving average. The green line is the 50-day moving average. And the yellow/blue line is the centered 50-day moving average — it’s the most important one.
Right now, I’m following that blue line on the far right.
I get concerned when it dips below the green line. That tells me a correction is imminent. We saw it happen earlier this year.
But when it stays above the green line, it tells us the market is maintaining its bullish momentum. And we want to benefit from that.
It’s important to note that in a bear market, the yellow moving average will fall below the red moving average. This is a sign to be extremely bearish.
Once the green line falls below the red line, I’m extremely cautious. That usually occurs after a correction in the market, although the latest correction wasn’t steep enough to trigger this event.
That’s a big reason why I was telling you to buy stocks after the correction.
What I also noticed earlier this year that helped me stay bullish, was that the S&P 500 bounced higher from support at the 200-day moving average, the red line.
Then in March and April, we started to see the blue line cross back above the green line, which supported my bullish stance.
In short, this is a critical chart that tells us to be bullish right now.
It can change rapidly.
When it does, I’ll know how to react. And, more importantly, how to profit.
Regards,

Chad Shoop, CMT
Editor, Automatic Profits Alert