Black-necked swans, as I first defined here, are ominous-looking market events.
That’s a key distinction. They look bad. But they turn out not to be. They might even turn out to be good.
Last week, I noted there might be more black-necked swans than black swans right now. One example is inflation. It’s slowing, and I expect that trend to continue. And the reason why is simply down to how inflation is calculated.
Housing costs account for more than a third of the inflation equation. The formula also uses old data to report housing costs.
Prices stopped rising rapidly months ago. That factor alone will reduce inflation for the next six months.
We need look no further than the plummeting yearly growth rate in the U.S. House Price Index for the proof:
United States House Price Index, YoY Growth
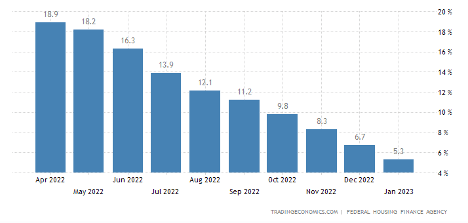
That’s why inflation is a black-necked swan. The idea of inflation is ominous … but the body of the story hides potentially good news.
This is one of many black-necked swans at play right now. Several of them even exist outside the U.S.
OPEC’s recent production cut is an example. It looks awful on the surface — many analysts are calling for a return to $5+ gasoline.
But as with any black-necked swan, we need to look deeper to understand how bad the news really is.
Let’s do that…
The OPEC Cut Was No Surprise
Over the weekend, OPEC cut production by over 1 million barrels per day, following a 2 million barrel cut back in October.
Now, the laws of supply and demand point to higher oil prices. Supply is contracting and demand is seemingly rising. That’s the scary headline. The black neck of the swan.
But the rest of the story — and the swan — is about demand. And the latest estimate from the U.S. Energy Information Administration shows the current global oil demand is less than supply. That actually points to lower prices, not higher.
In 2023, the EIA estimates supply will exceed global demand by almost 60,000 barrels per day. Next year, EIA forecasts an excess of 30,000 barrels per day.
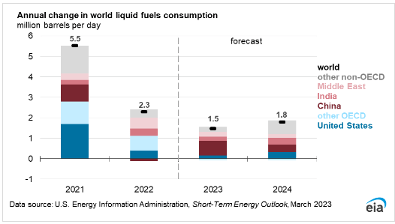
These are small amounts. But if supply exceeds demand, prices will fall. OPEC doesn’t want prices to fall. That’s why they cut production.
History shows OPEC often cuts production to prevent a steeper price decline. Since 1998, OPEC announced at least 16 production cuts. Six months later, the price of oil was lower seven times.
That’s why this is a black-necked swan. OPEC seems to focus on global economic indicators. It may be cutting production just to avoid a deeper price decline when it sees weakness approaching.
Lower inflation and falling oil prices are two major black-necked swans to watch for.
But stronger than expected growth may be the biggest…
Economic Data Keeps Surprising to the Upside
The United Kingdom plunged into crisis last fall when interest rates suddenly jumped. Pension funds had bet on rates remaining near zero. When rates rose, they faced losses.
The credit market froze. The prime minister lost her job in less than a month. Now, the Bank of England and the government both expect a recession to start this quarter and last into 2024.
On its face, this is all cause for concern. The “problem” is, economic data keeps coming out better than expected.
Recent revisions to GDP data showed the U.K.’s economy was stronger that initially reported. That shows the economy is more resilient than expected in the face of double-digit inflation.
In March, a survey of businesses showed improvement in demand, confidence, hiring and investment intentions. This data is similar to the Institute for Supply Management (ISM) data we study in the U.S., and shows that the economy is continuing to grow in the U.K.
The U.K. isn’t alone. Data is better than expected in most countries.
The chart of the Citigroup Economic Surprise Index shows that. This index sums the difference between official economic results and forecasts for economies around the world.
Readings above 0 show the economy is doing better than expected. We usually see this when global economies are growing.
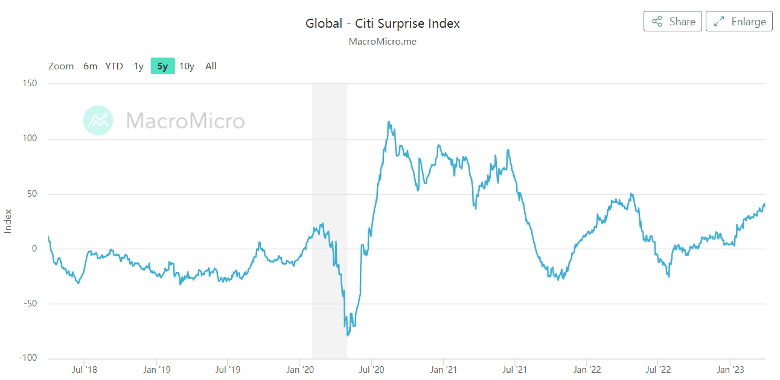
(From MacroMicro.)
There are two parts of that index — the forecast and the data.
The forecast is the ominous part of the news. Actual data is the good news. And now, with the line above 0 and trending higher, we’re looking at another black-necked swan.
Trends can and have reversed suddenly. Look at the past three summers for evidence of that.
But right now, the Surprise Index shows blacked-neck swans are lurking everywhere.
Another area to watch — especially in light of the recent U.S. banking crisis — is global banks.
Another Black-Necked Swan in Credit Suisse
We’ve already seen signs that the banking crisis isn’t confined to Silicon Valley.
Last month, UBS agreed to buy Credit Suisse. When the news came out, this seemed like the bank contagion spreading further. But in reality, the problems at Credit Suisse are nothing new.
The bank’s stock has been in a downtrend since 2007. Shares of Credit Suisse fell in 11 of the past 15 years. Finally shutting the bank down could be a positive development.
The same could be true for Deutsche Bank. That bank’s stock has also declined in 11 of the past 15 years. (By contrast, the SPDR Financial Select Sector ETF (XLF) fell in just 7 of those years.)
Closing down inefficient large banks frees up capital for productive investments. This is the creative destruction that Austrian economists believe clears the way for economic growth.
That makes the failure of large banks a potentially positive outcome from what, again, sounds awful.
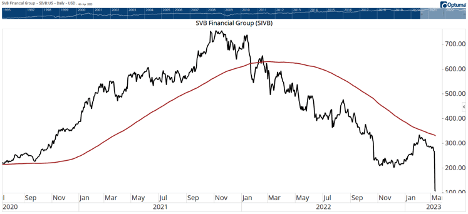
Of course, the outcome for shareholders in failed banks will be negative. That means it’s important to invest wisely. Simple tools like a 200-day moving average can help you do that.
A chart of Silicon Valley Bank is below. Prices (black line) fell below the 200-day MA (red line) in February. The stock traded above $600 then. By the time the bank’s problems were in the headlines, the price was more than 55% lower.
It’s easy to get caught up in the negativity of headlines. Since 2010, research shows that news headlines have grown increasingly negative and decreasingly positive. Seemingly, negative news drives more attention.
Investors don’t have much good reason to get caught up in this. Because contrary to popular belief, money is what drives markets — not news.
In the example above, capital outflows from Silicon Valley Bank signaled a collapse more than a year before it happened. There were no headlines from January 2022 suggesting anything of the sort.
I encourage you to stay skeptical of any negative-sounding headline you see, and find ways to look deeper and check the narrative against the data. You’ll likely find that there’s more reason for optimism than pessimism.
Regards, Michael CarrEditor, One Trade

Inflation’s Still “Sticky,” but We’re Over the Worst
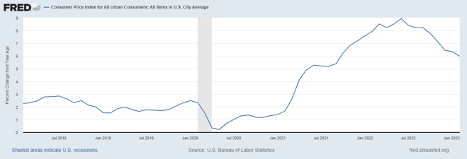
As Mike Carr pointed out, inflation is generally trending in the right direction.
Consumer price inflation is still clocking in at about 6%, which is far too high for my comfort level. But it’s a lot better than the 9% we saw last summer, and it’s continuing to inch lower.
We’ve likely reached “peak inflation.” And the disruption that it’s caused should recede from here, as we can see in the chart below.
That said…
Consumer price inflation is an average. It includes “a little of everything,” and some prices tend to adjust more quickly than others.
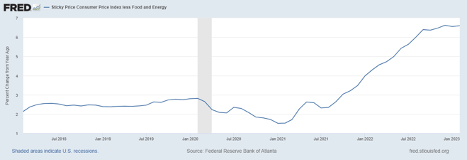
The Federal Reserve Bank of Atlanta tracks what they call the “sticky” Consumer Price Index, which covers the prices of items that tend to change slower.
This index is made up of a broad collection of industries, including car insurance, medical care, mobile phone service, meals in restaurants and even booze, among other things.
But the data in the following chart is telling a different story than the first. Inflation has leveled off at around 6.5%, but it’s not trending lower just yet.
Again, this isn’t necessarily all bad. Inflation has stopped getting worse. That’s good!
But we’re still seeing annualized inflation at 6.5% in the prices of things that don’t normally move all that much. Some of this “stickiness” is due to structural factors that have no quick solution, like the labor shortage.
However, there are a few takeaways from this.
First, as Mike pointed out, the rumors of the economy’s demise are greatly exaggerated. The overall situation seems to be stabilizing.
While inflation isn’t going away, its rate pace is no longer accelerating. And yet, the prices on most common goods are still getting 6.5% more expensive every year. That means the Fed will continue to face pressure to keep rates high.
Inflation is great for certain asset classes like commodities, precious metals, real estate and the stocks of companies with strong pricing power. It’s not as good for long-term bonds and start-up companies.
But it’s also great for the energy sector — specifically in the oil and gas industry.
Yesterday, Charles Mizrahi pointed out that the global oil supply is projected to fall short of demand in 2023. This will make oil prices soar in the next few years. You can take advantage of this in two ways:
- You can trade on his recommended ETF, the Energy Select Sector SPDR Fund.
- You can watch his free video presentation detailing his top recommended trade in the energy sector — right here!
Either way, make sure you take advantage of the sectors that are thriving even in the throes of inflation.
Regards, Charles SizemoreChief Editor, The Banyan Edge