
Sitting in my firm’s investment committee meeting in April 2009, it was clear we had a problem.
A good problem to have. But still a problem.
Since I started at the firm the year before, we’d been decidedly bearish. That served our clients well in 2008. We gained about 10% for the year while the S&P 500 lost almost 40%.
That performance earned us a lot of new clients. We started 2008 with about $80 million under management. By the end of the year, we had over $150 million.
We wanted to keep the clients. Our management fee was 2% a year. Keeping clients was good for the business. But that’s where we ran into the problem.
Our new clients, who came on board after seeing us make money in 2008, liked our bearish outlook. It confirmed their opinions. Shifting course could upset them.
But in April 2009, the data pointed to a market rally. That meant we’d have to shift course after proving to all these new clients that being bearish made money.
But while everyone was looking for a continued meltdown, I believed the bear market was over and the biggest risk we faced was a market “melt-up”.
I knew this would be tough to explain to clients. But I also knew performance mattered more than feelings.
We decided we would communicate our shift with detailed data. We turned bullish.
And that got me thinking about swans…
Not the “black swan” you might be familiar with. And not the “white swan,” which would signal the opposite.
I started thinking about a different kind of swan, and how my firm could exploit it to our advantage.
Ominous From Afar
A black swan is among the most popular terms in finance. It refers to an unexpected event that crashes markets.
The pandemic was a black swan. So was the collapse of Bear Stearns and Lehman Brothers in 2008. No one could have seen those Wall Street giants collapsing in a matter of days.
These events are rare. But they seem fairly common, because everyone’s always looking for them. That’s especially true right now with potential black swans everywhere.
Inflation caught the Federal Reserve by surprise. Fed officials might say it was a black swan because their models told them not to worry.
Others might argue the current officials who missed something so obvious is a black swan. They could miss something even worse in the future.
Some see Russia’s invasion of Ukraine as a black swan. It caused untold human suffering. It also affected energy and grain markets. This compounded the suffering. It also created market volatility.
All of this was largely unexpected, despite Russia amassing troops at the Ukraine border for months beforehand.
There are many more potential black swans to uncover. Analysts love searching for them.
But just like in April 2009, I think we need to look for black-necked swans.
Like the black swan, these swans are also rare. They have a black head and neck … but a white body.

(Source: Alexandria Zoo.)
To me, black-necked swans represent market events that look ominous … but aren’t. There might be more potential black-necked swans than black swans right now.
3 Charts to Suggest a Black-Necked Swan
Inflation could be slowing, as just one example. Slower gains in housing and energy costs point to that.
Consumers will still feel the pain. And they’ll feel that pain for years, since the Fed’s goal of 2% inflation is both far away, and will still hurt more with prices generally higher.
But lower inflation gives the Fed room to cut rates. So if inflation is the black neck of the swan, lower interest rates are the white body.
Let’s say inflation does keep slowing. Lower inflation gives companies room to raise prices. If they can boost prices by 1% or 2%, that drives higher profits. Many companies have already reduced their headcount and the lower costs also help profits. It is possible profits will be better than expected this year.
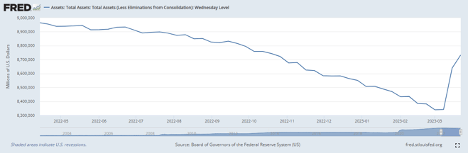
Even if the Fed doesn’t cut rates, it has other methods of boosting the economy. One way is quantitative easing, aka buying bonds with printed money.
That process actually started two weeks ago during the banking crisis. The Fed is buying bonds from banks. That’s a return to the quantitative easing policies that fueled stock market booms in 2009 and 2020. We can see that in the Federal Reserve Balance Sheet:
There’s also a potential shift in consumer sentiment.
How consumers feel about the economy shows a strong relationship to the stock market. Lower inflation should boost sentiment. That in turn should boost stocks.
We’re already seeing signs of sentiment improving in the University of Michigan Consumer Sentiment survey.
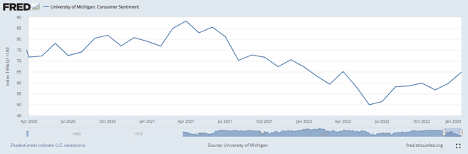
The survey hit near all-time lows last June. It’s up by about 15 points since then.
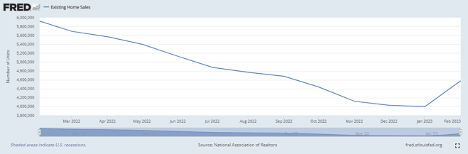
But it goes beyond the survey. Home sales are also picking up. That’s the ultimate sign of consumer optimism.
Buying a home is the largest purchase most of us make in our lives. We need to believe the home offers value, or we won’t buy. The recent uptick in sales is bullish for the economy and the stock market.
Any one of these events could lead to stock market gains.
I’m not saying I see melt-up potential, like I did in 2009. But I do see room for higher prices.
I’m also not saying you can go out and buy anything right now and make money. Those moments are rare. We enjoyed that kind of market in April 2009 and again in April 2020.
Today we’re looking at a market where the news might not be as bad as feared. That makes it the ideal market environment for traders.
When most investors expect the worst, and you can identify areas that should surprise those investors, you can position yourself for quick rallies as investors adjust their expectations.
I’m doing that every day with my subscribers in my live Trade Room. In just the first 15 minutes after the open, we have enough data to set up a trade with the potential to make 50% gains in no more than two hours.
We’ve been able to do that several times in the last couple weeks. As investors continually adjust their expectations in the weeks to come, I anticipate even greater profit opportunities.
I should mention that this strategy is one of seven that my subscribers and I use in my live Trade Room. Trading multiple strategies offers both opportunities and limits our risk.
Another such strategy involves generating income. To do that, we trade short-term credit spreads to generate income.
We’ve closed six of these trades so far — all winners. Overall, we generated $185 in income and never risked more than $500. That’s a 37% return. and we’re finding more of these trades all the time.
If you’d interested in how you can trade these ideas alongside me, click here and get all the details.
I urge you to do it soon. Access to my Trade Room closes today, and we may not open it again for quite some time.
Regards, Michael CarrEditor, One Trade

Can You Buy a New Home in 2023?

Continuing Mike Carr’s theme of things looking not quite so bad, let’s take a deeper look at the housing market.
Yesterday, I talked about the challenges of being an investor in real estate. But what about as a buyer?
As Mike pointed out, new home sales enjoyed a major bump last week, reversing a nasty downtrend in sales that had been in place for the past year.
Of course, the biggest factor here is affordability.
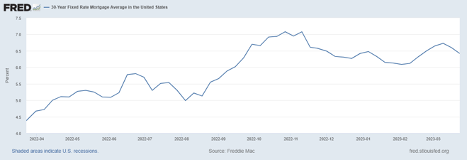
Americans got sticker shock when mortgage rates shot up from 2.7% in early 2021, to over 7% by late last year. But now, rates are trending ever so slightly lower.
As of last week, the average 30-year mortgage rate was 6.4%. That’s still high, but potential homebuyers have had an extra year to get used to this inflated reality.
Now that they saw a modest pullback in both prices and mortgage rates, that house they wanted is starting to look a little more affordable.
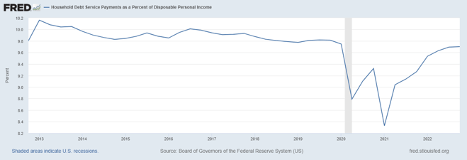
Homes are still far from affordable for the average family, particularly after we got used to phenomenally low rates during the COVID pandemic. There’s little doubt there. But household debt service payments are roughly at the same levels they were back in 2019.
I’m not saying life was perfect before COVID, or that every American carried a perfectly comfortable amount of debt. But this chart below shows that today’s situation isn’t completely out of line with the historical norm.
I don’t expect that we’ll see an explosion in home prices any time soon. While home prices have dipped a little, if prices move too quickly, we’ll be right back where we started — with lack of affordability crimping demand again.
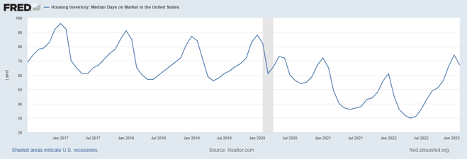
The inventory data suggests the market is still fairly tight. That’s actually good.
The median days a house sits on the market popped over the past year, but it’s still right in the middle of the common range before 2020.
And, for what it’s worth, I still get close to a dozen phone calls per week from people trying to buy my rental home. I briefly put it on the market two years ago, and it hasn’t been listed since.
But when I am getting calls from strangers hoping to buy my home, it tells me the market is still pretty strong.
I’m not suggesting you go and mortgage yourself to the hilt to buy new properties. I’m still playing it conservatively for the time being. Even so, we’ll take this as a bit of good news for the real estate market.
Regards, Charles SizemoreChief Editor, The Banyan Edge