
Investor Insights:
- I just spotted a rare signal in the S&P 500 Index that screams “sell.”
- The last time this signal occurred, stocks dropped 12% over two weeks.
- Today, I want to show you how to trade the coming S&P 500 pullback and grab massive profits.
Millennials ruined many things, from napkins to department stores. But they also created new things, such as mountains of student loan debt and participation trophies.
Participation trophies are prizes for showing up. Instead of rewarding performance, this trophy recognizes the fact that someone partook of something.
Some argue that rewarding participation instead of winning teaches the wrong lesson. Others argue that participation trophies identify what’s important. As movie director Woody Allen said: “Showing up is 80% of life.”
Analysts track how many “participation awards” are handed out in the stock market. Each stock trading above its 200-day moving average increases the value of the popular market breadth indicator.
It doesn’t matter if the stock is 0.1% above its moving average or 20% above. Just participating in the trend pushes the indicator higher.
When too many stocks receive these participation awards, the stock market actually turns down.
In today’s article, I’ll explain why that happens.
I’ll also show you how you can trade a market pullback to grab a 490% gain in less than two months.
This Signal Flashed Right Before Each Pullback
I just spotted a rare sell signal in the S&P 500 Index.
When 80% of the stocks in the S&P 500 are in long-term uptrends, the indicator screams “sell.”
Few investors track this indicator. That might be why it’s valuable. In the stock market, it’s usually profitable to go against the crowd at important turning points.
Many investors only look for long-term signals. Maybe that’s why few follow this indicator. They forget avoiding short-term losses can dramatically increase your wealth.
The four most recent sell signals are highlighted in the chart below. These signals tend to occur about once a year.
The 4 Most Recent Sell Signals
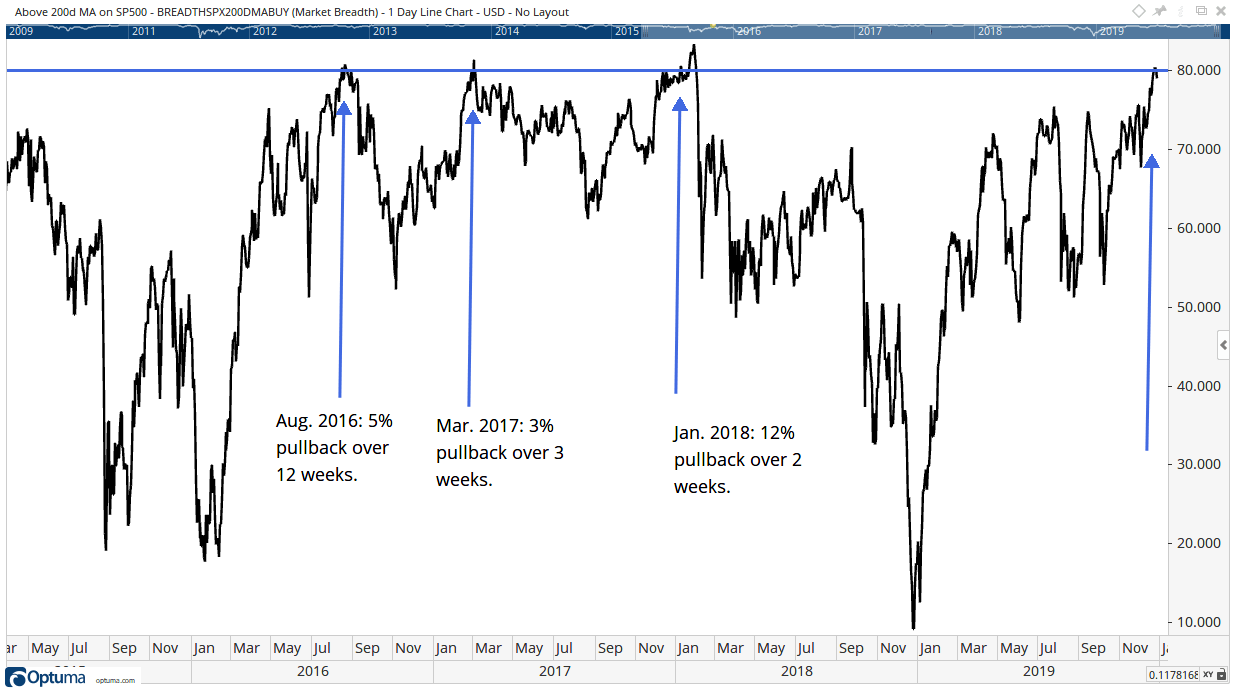
The chart shows two of the signals marked minor pullbacks. But one marked an important top, after which stocks dropped 12% over two weeks.
The latest signal just occurred at the end of December. It’s the arrow at the far right side of the chart.
Your Trading Strategy for the Coming Pullback
In the chart above, arrows mark the times breadth moved above 80%. Each signal was followed within weeks by a tradable S&P 500 pullback.
By tradable, I mean that put options delivered gains.
A put option gives the buyer the right, but not the obligation, to sell a stock or exchange-traded fund (ETF) at a specified price any time before the option expires. It increases in value when prices fall.
To collect a gain, you simply close the option with a sell order, just like you do with stocks.
Options offer defined risks. You can never lose more than you paid for the option. Risks are generally small in dollar terms since options often trade for just a few hundred dollars.
To trade this signal, buy put options on the SPDR S&P 500 ETF (NYSE: SPY).
SPY is an ETF that tracks the S&P 500.
Specifically, for this signal, the February 21 $323 put on SPY trades at about $5.40.
If the index drops by 3%, this option will deliver a gain of about 80%.
If the index drops by 10% or more, the option delivers a gain of more than 490%.
History says there’s a high probability of a short-term gain available right now with put options. Take advantage of this opportunity now and start off the new year with big profits.
And for more ways to make money with options, check out my Precision Profits service.
Regards,
Editor, Peak Velocity Trader
P.S. To learn more about how to trade options, check out my seven-minute video below: