I broke some cardinal rules of investment analysis in Las Vegas last year.
Many successful analysts speak in general terms. At last September’s Total Wealth Symposium, I gave a specific forecast.
Then I went one step further. I shared the exact tool I created to track the market.
Attendees learned I expected a bear market in the fourth quarter. Then I explained how I would know when it started and when it ended. I shared the details of the indicator I developed for that purpose.
They left Las Vegas with everything they needed to track my forecast. And they had an indicator that warned of last year’s market decline.
You could argue I was wrong. Major stock market averages only fell 19%, not quite the 20% needed for a formal bear market.
But a 19% decline is close. I consider the forecast correct, and I think the indicator I shared is a valuable tool for any analyst.
How to Sleep Better at Night
Of course, you can verify everything I’m saying.
A chart of the S&P 500 Index with arrows highlighting the sell and buy signals is below. The indicator is at the bottom of the chart.
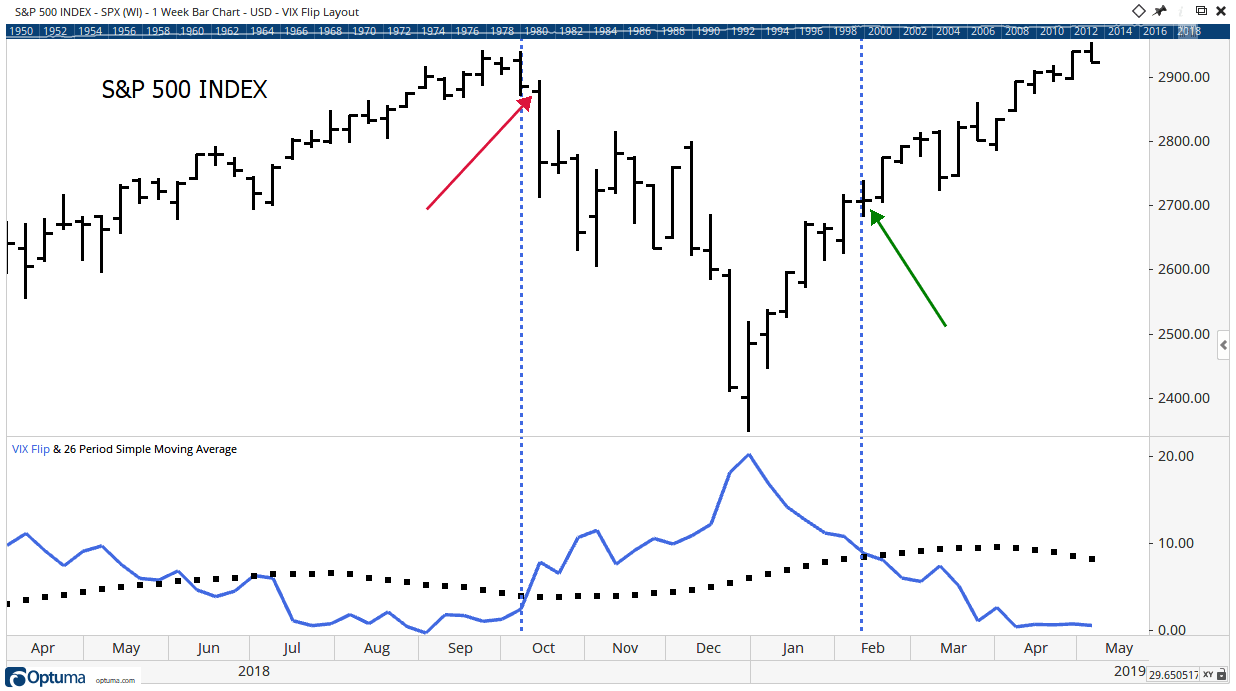
Vertical dashed lines show the sell signal in early October and the buy signal in February. Arrows highlight the price levels of those actions.
This isn’t a perfect indicator. The buy signal came after a significant rally.
But the sell signal is just 2.2% below the top. Avoiding that decline, investors who followed this sell signal slept well at night while other investors suffered large losses.
Avoiding large losses has a large impact on wealth. Even after missing the bottom, getting back in on the buy signal means an investor is 8.9% wealthier than they would have been if they participated in the decline.
Specific Forecasts Like That Are Unusual
Over the years, I spoke to many great market analysts. Some are regulars on CNBC and Bloomberg.
Almost all said they avoid specifics. That way they are always right.
It’s common to hear things like “this market is going higher unless something unexpected happens.” Personally, I’m not a fan of that approach.
In my opinion, we analyze markets to make money. You can’t make money from statements like that.
Of course, that analyst will always be right. In six months, the market will be higher, or something happened. Either way, they claim an accurate forecast.
In Las Vegas, I said there were already signs of weakness. I said the bear market would begin in the fourth quarter. And then I shared that indicator at the bottom of the chart.
Other speakers, my colleagues at Banyan Hill, also provided specific forecasts.
We hold ourselves to the highest standards and believe you deserve clear forecasts. We also share details about how we make our forecasts.
An Indicator Based on Fear
I introduced an indicator that I call the VIX Flip.
It’s not VIX, although it behaves like VIX, the popular indicator that’s known as the “fear index.”
VIX is based on prices of options-tracking futures contracts for the S&P 500. It’s found with a complex formula that’s designed to move higher when fear rises. When traders are greedier, VIX falls.
VIX tracks changes in emotions. But it only tracks emotions of traders in the S&P 500.
Now, that’s not usually a problem.
There are hundreds of other indexes and thousands of individual stocks. Most move in line with the S&P 500 most of time. But they are all a little different than the S&P 500.
Sometimes, individual stocks show fear or greed earlier or later than the S&P 500. That led me to search for an indicator that would work like VIX for any stock.
The VIX Flip does that. This indicator measures the emotion of traders and shows whether fear is rising or falling for just one stock or exchange-traded fund (ETF).
The calculation is simple. It compares the latest low to recent closing prices:
- Find the highest closing price in the last month. Let’s call that value X.
- Subtract the value of today’s low from X. Let’s call that difference Y.
- Divide Y by X. We can call that Z.
- Multiply Z by 100 to make it a percentage.
Fixing the Problems With VIX
There are two parts to the VIX Flip, each addressing a different problem with VIX.
In the chart above, the indicator is the solid blue line. You can calculate this line for any stock, ETF or anything that’s traded. That fixes the problem that VIX applies solely to the S&P 500.
The dashed line in the chart is a moving average (MA) of the indicator.
By adding an MA to the indicator, we can spot when emotions change. When the indicator moves above its MA, fear is rising. That’s time to sell.
If fear is falling, the indicator drops below the MA. That’s a buy signal. Flips in the indicator provide the trading signals.
The MA corrects for the problem that there is no way to know when VIX is showing extremes in fear.
For example, VIX reached its all-time high in October 2008. Both stocks and VIX fell for six months after that.
Traders relying on VIX had no way of knowing prices would fall in October 2008. They also didn’t know that a bottom formed in March 2009.
With an MA and the VIX Flip, we have a complete trading strategy. We know when to sell in bear markets and when to buy after the decline ends.
The Total Wealth Symposium
This strategy worked in 2018, in 2009 and in every bear market since the S&P 500 was introduced in 1929.
Of course, my presentation on the VIX Flip was just one hour in three days of presentations at the Total Wealth Symposium. Attendees found something of value in each hour of the symposium.
Since last September, my colleagues and I continued researching the markets. We’ll share our latest work in Amelia Island, Florida, in just a few months.
Personally, I can’t wait to see the presentations, and I can’t wait to share my latest ideas.
Regards,
![]()
Michael Carr, CMT, CFTe
Editor, Peak Velocity Trader