Investor Insights:
- Norm Fosback wrote about holiday seasonality in 1976.
- He programmed a test that proved holidays were bullish.
- His research inspired this holiday trade for the end of October.
I was in New York City last week. Like many visitors to the city, there’s one place I always try to see.
It’s not a restaurant or a popular attraction. It’s a used bookstore on Broadway called Strand.
Readers from around the world visit this store. There are 2.5 million books on 18 miles of bookshelves.
Employees must pass a test on great works of literature. They’re experts on books and eager to help.
Strand is a unique place. You should stop in if you get to New York.
When I enter, I go straight to the basement, take a left at the bottom of the stairs and head to the back wall.
My first stop is the cart with unshelved investment books. These are new arrivals or books other browsers decided they didn’t want.
On that cart, I often find valuable books. Once, I found Norm Fosback’s Stock Market Logic.
This book dates to 1976. It’s among the first, if not the first, book to use a computer to test trading ideas.
One of the useful ideas in the book is what Fosback called “holiday seasonality.” And it’s what led me to today’s trade, which could hand you profits in just four short days.
Holidays Offer Trading Opportunities
In the book, Fosback tested beliefs of old traders. One belief was that holidays were bullish.
It was difficult to program a test for that in the 1970s. But Fosback did that, and he wrote:
From 1928 to 1975, this strategy gained 778%.
The S&P 500 Index gained only 414% over that time.
Much has changed since 1976, however. One change is that commissions fell by 100% since discount brokers now offer zero commissions.
You can also trade indexes now, or options on indexes. Neither was available to individual investors when Fosback wrote.
Trading the Upcoming Holiday
Halloween isn’t an official holiday, but it feels like one.
Grandparents enjoy pictures of children in costumes. Millennials party and insist no one knew how to throw Halloween parties before their generation.
There are feelings of goodwill. People are happy.
That’s important for stock market investors. The preholiday syndrome exists because of bullish sentiment.
Good feelings around Halloween explain why there’s a holiday trade at the end of October.
The Rules of the Trade
For a “ghost and goblins” trade, you can buy the SPDR S&P 500 ETF (NYSE: SPY).
This is an ETF, or exchange-traded fund, that owns the individual stocks in the index. You can trade the S&P 500 with this ETF.
We’ll use Fosback’s rules:
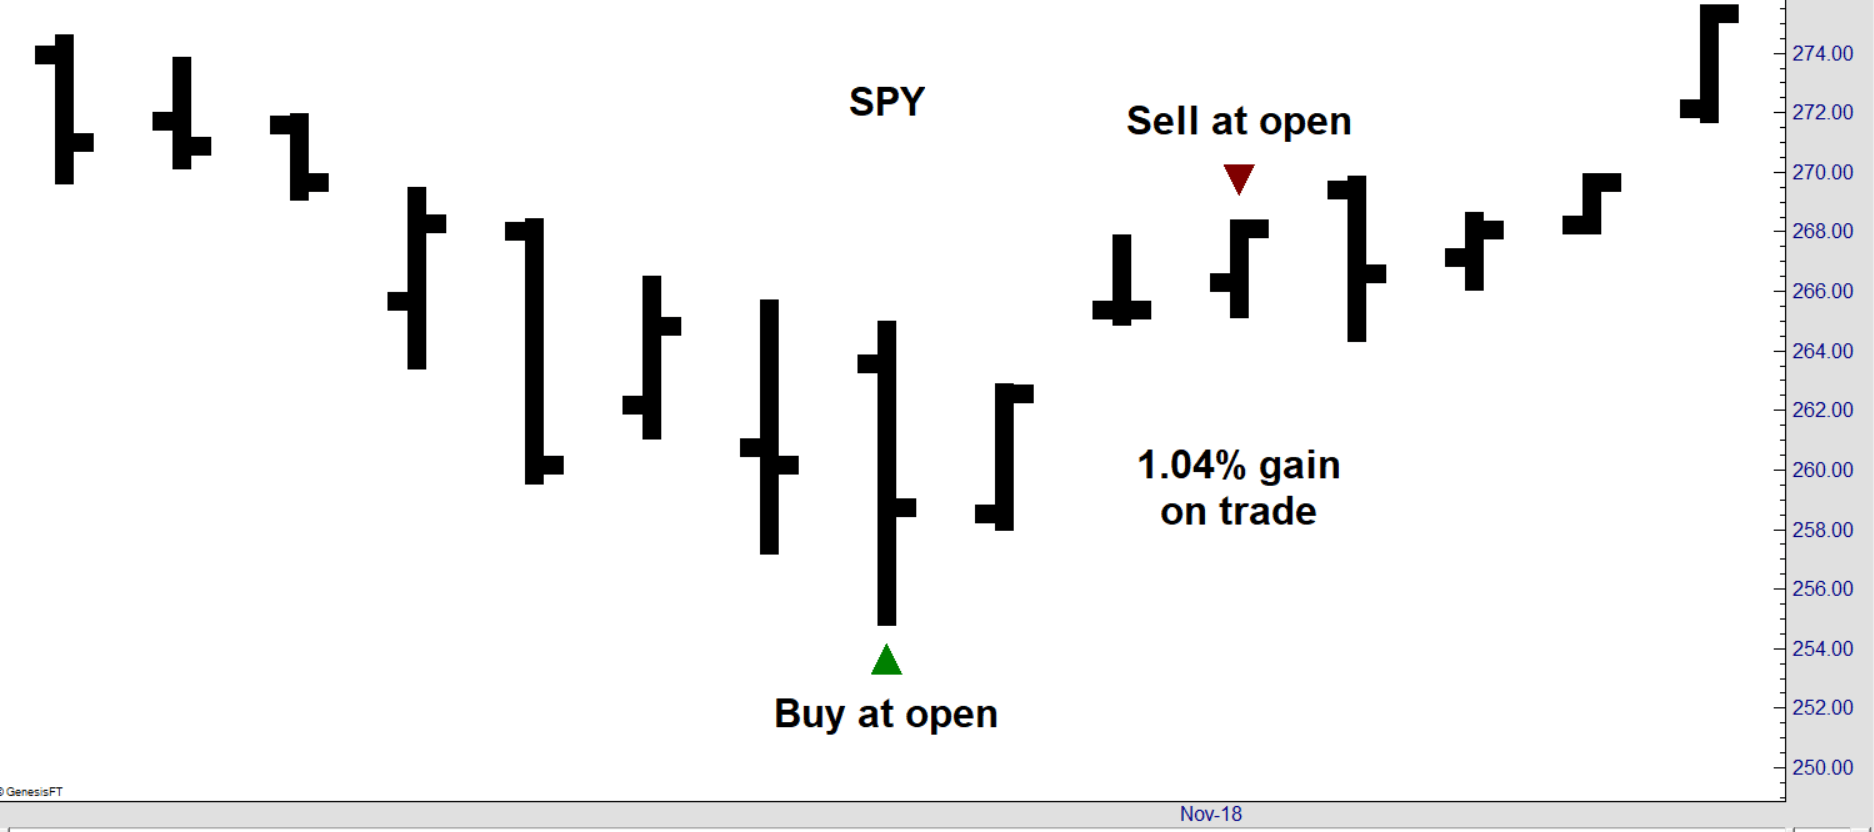
- Buy at the open two days before the holiday.
- Sell at the open the day after the holiday.
The chart below shows how the trade looked last year.

Testing shows this trade delivers a gain 65% of the time. The average gain is 0.6% over just four days.
This is significantly better than a random trade entering at any other time of the year. A random entry delivers an average gain of 0.1% over four days, with wins 55.5% of the time.
You can increase the potential gains and limit potential losses with a call option.
A call option gives the buyer the right, but not the obligation, to buy the ETF at a specified price at any time before the option expires.
You won’t have to exercise the option to collect a gain. You could simply close the option with a sell order.
Options offer defined risks. You can never lose more than you paid for the option. This means risks are small in dollar terms, since options usually trade for just a few hundred dollars or less.
For SPY, traders could buy November 1 $298 call options for about $400. This is the right to buy 100 shares of SPY at $298 any time before November 1.
For this trade, you buy a call or the ETF at the open on October 29 and sell at the open on November 1.
That’s it. Those are the complete rules for this trade.
Over time, the preholiday syndrome could greatly boost returns with simple trades just a few times a year.
Regards,

Editor, Peak Velocity Trader
P.S. I had a great discussion with Ted Bauman last week about the recent market volatility. You can watch it now by clicking on the image below:


