
While I was going back and forth with my editors about last week’s piece on bonds, I noticed they had quite a few questions about how bonds work.
I wasn’t too surprised. These guys know their stuff… But even the most experienced traders have ignored bonds for many years.
They’re a tricky subject to grasp, for one thing. Stocks are a lot more straightforward by comparison.
Bonds have also been a pretty poor investment. For the past 12 years, bonds have returned an average of 3.5% per year while the stock market has returned 13.6%.
Nonetheless, traders who master bonds are privy to opportunities most others won’t ever consider. It gives you a unique edge.
Today’s True Options Masters dispatch is about helping you find that edge. Especially when certain market forces seem to be making that more difficult…
Times Have Changed
Let me first back up a bit…
A few decades ago, the bond trade was simple and reliable. Since interest rates peaked in 1980, bonds delivered large and consistent gains. To benefit from that trend, many traders simply bought a bond fund and let it sit in their account. Doing this would’ve earned you an average yield of 7.6% on your money with next to zero risk.
Unfortunately, times are changing.
Bonds have offered poor yields since the Great Financial Crisis of 2008. Since then, bonds have yielded an average of 2.3% per year.
It’s not a simple buy-and-hold game anymore. Traders now need to learn the nuances of bonds in order to trade them profitably.
As I showed you last week, there are still great opportunities in bonds if you look beneath the surface. I shared a specific opportunity I think could deliver 280% profits over the next one to two years. I expect those opportunities to become more frequent, too.
And right now there’s suddenly a lot going on in the world of bonds.
The Federal Reserve is poised to raise interest rates as soon as next year. That will have an outsized impact on the bond market, which is what’s giving us that 280% opportunity.
Beyond that, though, there’s something even more peculiar going on…
What Is the Fed Hiding?
As options traders, we only need two pieces of information. We need price and volatility data.
For years, both of these data series were available at the Fed’s website. But that changed last month. Just as bonds started becoming interesting again, the Fed took away volatility data.
The Fed’s database includes 20 different volatility indexes. Only one, volatility on 10-year Treasury note futures, was discontinued in May. See the chart below…
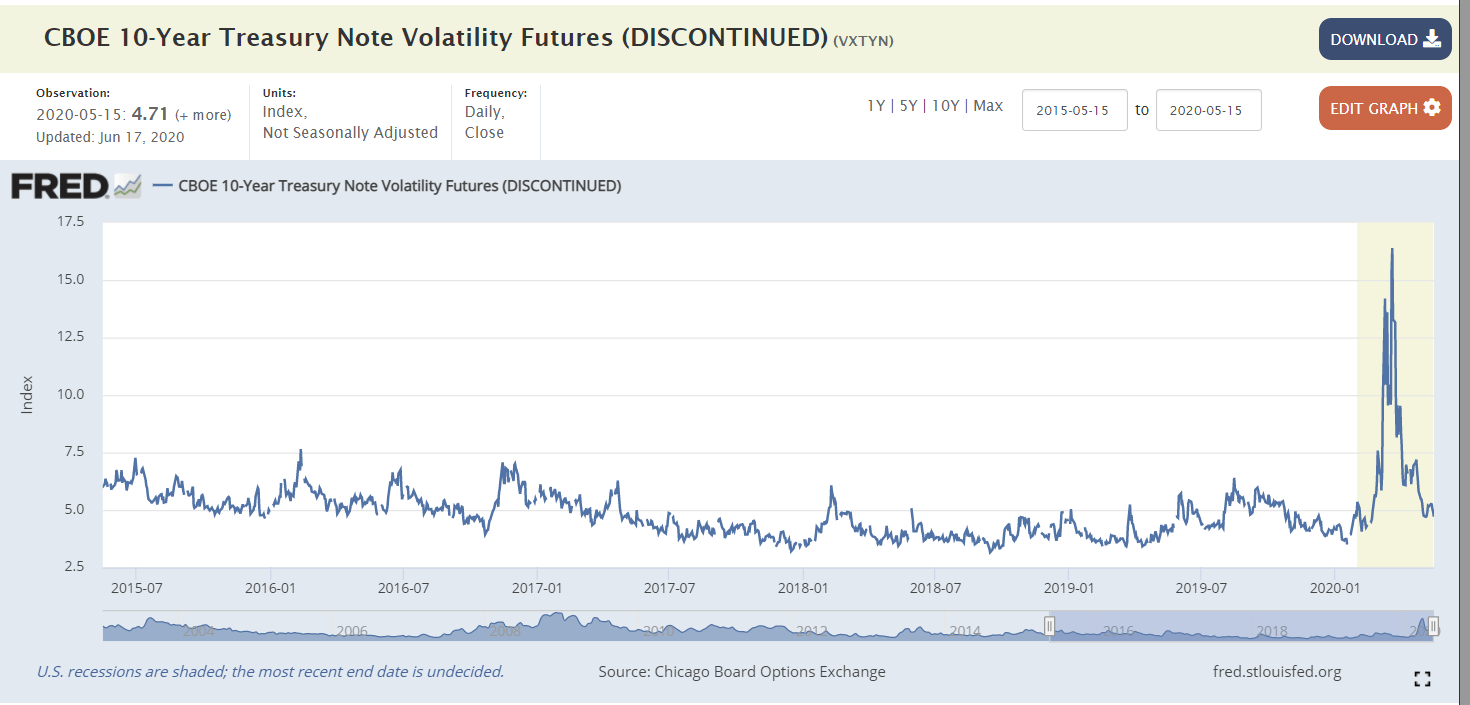
Source: Federal Reserve
(Click here to view larger image.)
Volatility spiked last year during the height of pandemic panic. You can clearly see that on the right side of the chart.
Now this year, the Fed has confirmed rates will begin rising within the next year or so. As rates rise, trading opportunities will increase and there could be big profits in bonds.
Here’s the thing… This recent confirmation almost directly coincides with the Fed discontinuing its 10-year Treasury Bond volatility index.
Now I’m not usually a conspiracy theorist. But this does raise questions.
All the data series are provided by the same source. They are all still maintained by that source. All that’s changed is one is no longer readily available to individual traders…
Why?
It’s almost as if the Fed doesn’t want individuals to see how much volatility it’s creating.
The Fed’s database was the only source of that data for most people — because the data was free.
Volatility data is still available on Bloomberg … but only to traders who spend about $25,000 a year for access. That’s beyond the reach of many individual traders.
Now, I couldn’t have predicted the Fed would restrict access to bond volatility data. I still can’t say for sure why it did.
But I was prepared for it either way.
My Solution
Years ago, I realized the value of volatility data. At the same time, I saw how limited it was. Remember, even before the Fed took away data on bonds, there were only 20 volatility indexes available, with all but one of them tracking equity markets.
So, I found an indicator that can calculate volatility on any price data…
Then, I found a way to generate trade signals from that indicator. Let me show you…
Check out the chart below of the U.S. 10-Year Treasury note…
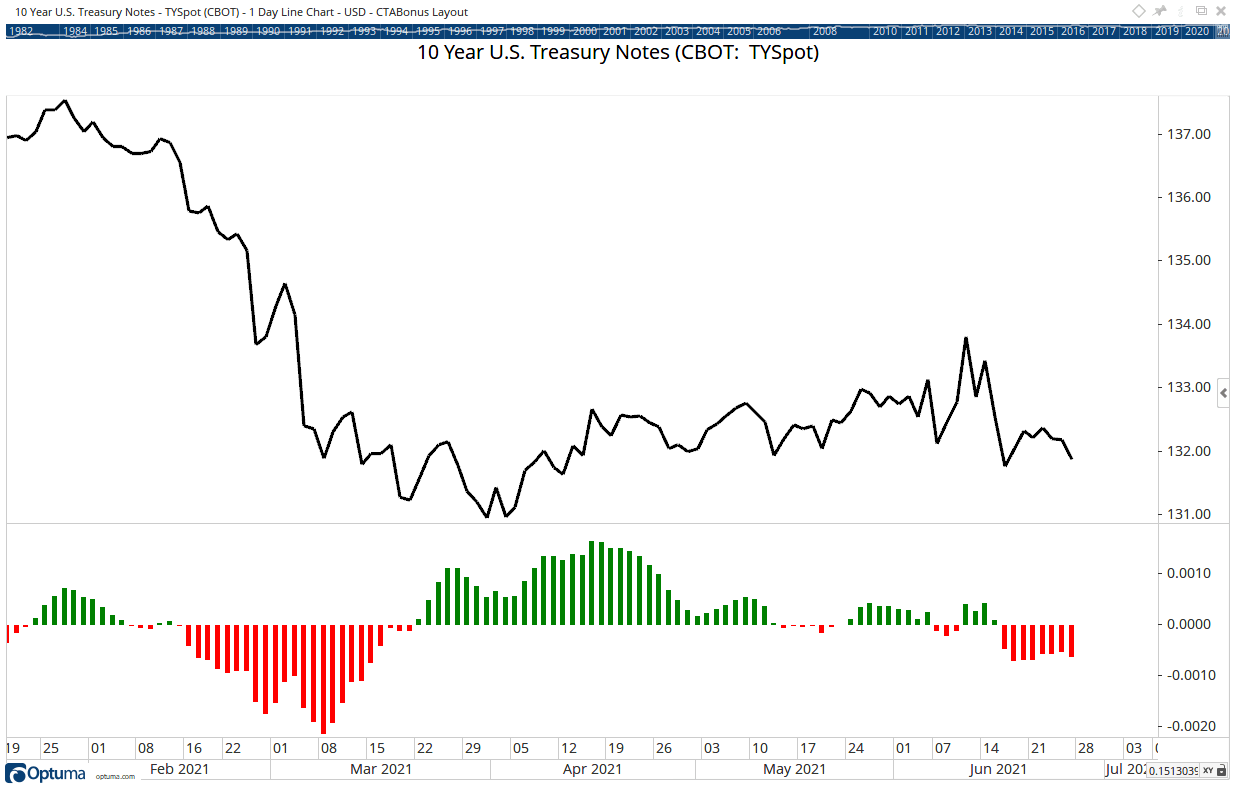
(Click here to view larger image.)
My Precision Profits Timing Tool is at the bottom of the chart — the red and green bars.
You can calculate a similar indicator on many websites, called a stochastics indicator.
But stochastics uses a series of calculations to smooth the formula’s output. My Precision Profits Timing Tool uses the raw calculation and applies a moving average. I plot it as a bar chart to make the signals easy to spot – buy on green, sell on red.
I find this method is far more reliable at making trading signals. It works like this…
For now, there is an active sell signal on the iShares 20+ Year Treasury Bond ETF (Nasdaq: TLT). This exchange-traded fund (ETF) is the best way for individual traders to access the bond market because it delivers the most bang for the buck. If interest rates change by just 1%, the price of this ETF should move more than 18%.
Since the current signal is a couple weeks old, it could be best to wait for the next signal on TLT. While the long-term trend in TLT is down, that trend will be interrupted by brief rallies and the next rally should be tradable. As soon as I see a signal, I’ll update you.
Using this tool, it’s still possible to find great trade setups on the 10-year Treasury bond. Even if the Fed doesn’t want us to see that information…
Regards,

Michael J. Carr
Editor, One Trade
P.S. To get content like this in your inbox every day, subscribe to True Options Masters. Click here and subscribe.