
Investor Insights:
- Many market forecasts are like bad New Year’s resolutions. Mine is different.
- This chart shows how the S&P 500 Index’s recent breakout sets up a trading plan.
- One important technical level is the key to knowing whether to buy or sell. Here’s my 2020 trading strategy.
As 2019 winds down, it’s time for resolutions. This annual tradition puts worthy goals into words.
By the end of January, many resolutions are history. One reason is overly ambitious wording.
For example, your resolution may be to eat better. Then a popular chain improves its chicken sandwich, which leads to a few fast-food dinners.
Just seeing those fast-food wrappers in the car can cause you to cast aside your “eat better” resolution.
A better objective might be to have salad once a week. This goal is measurable. You know if you’re on target.
Missing it one week doesn’t undo your entire goal. You simply reset for the next week.
Market forecasts work the same way. It’s all about being specific.
Around this time of year, analysts often give their forecasts for the new year. Some are like bad resolutions. They aren’t specific enough to guide investors through the year.
My forecast for 2020 is different because it gives you everything you need to know in one simple chart.
Let the Chart Forecast the Market
For my 2020 forecast, I started with a chart of the S&P 500 Index.
Specific Prices to Watch in 2020
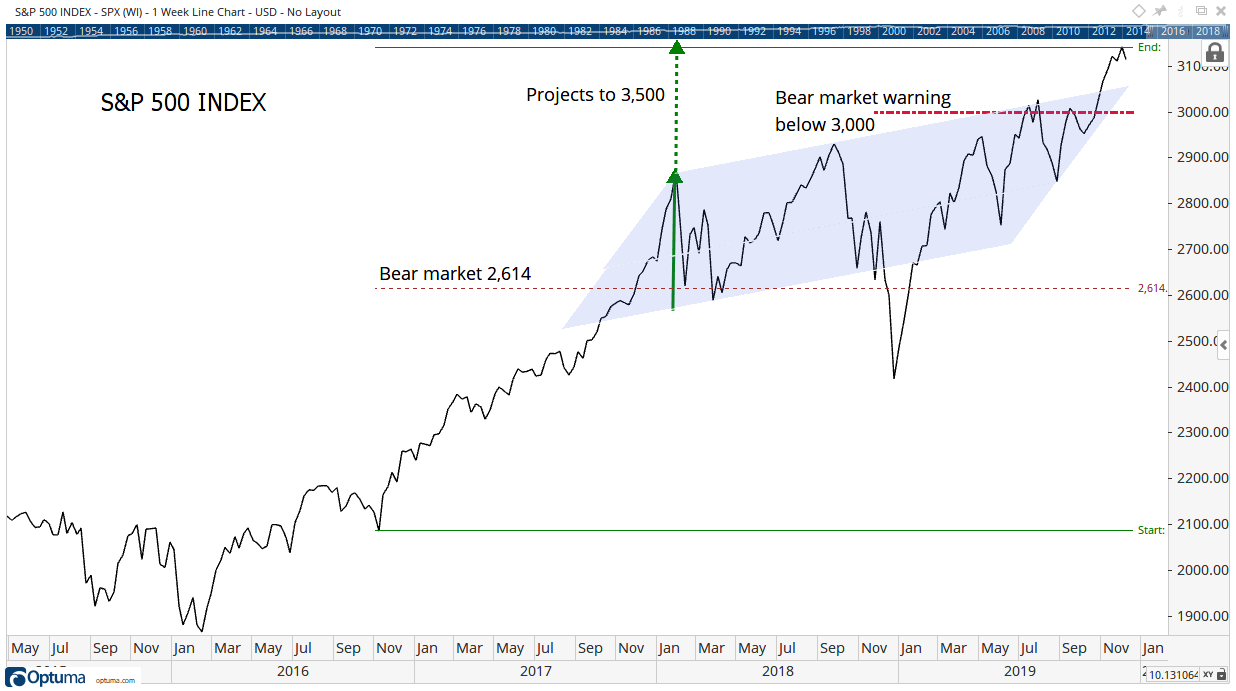
I used the S&P 500 because it’s highly correlated to other indexes. So, a forecast for the S&P 500 applies to the Dow Jones Industrial Average or other major indexes.
On the chart, the blue area highlights a trading range. Despite volatility, the index traded near the same level in January 2018 as it did in October 2019. That’s 22 months without gains.
The upside target, which is the dotted green arrow in the chart, is 3,500. That’s about 13% above the current price.
Below 3,000, the next red line on the chart is 2,614. This is the bear market level, or about 20% below the S&P 500’s high.
The recent breakout sets up a trading plan.
Technical analysts look for symmetry in the price action. Specifically, a breakout is expected to move a distance equal to the depth of the consolidation.
In simpler terms, if the consolidation is 200 points deep, a 200-point rally should be expected after the breakout.
That means it’s time to buy.
Traders Love Round Numbers
Charts also allow us to find important risk levels. In the chart above, 3,000 provides important support.
Support is where buyers are expected to enter the market. Their buying should stop the decline.
There are two reasons to expect support at 3,000.
First is the fact that this is a round number.
Larry Livingston, the mythical trader in the classic Reminiscences of a Stock Operator by Edwin Lefevre, noted the importance of round numbers in the early 1900s.
Quoting Livingston, Lefevre wrote: “Frequently I had observed that when a stock sold at 50, 100, 200 and even 300, a fast and straight movement almost invariably occurred after such points were passed.”
We can see a fast and straight movement followed the breakout above 3,000 in October.
Second is the fact that this price level stopped rallies three times in the past.
Some traders decided to wait for a pullback after the move through that level. The pullback never came.
Those traders have learned their lesson. That means they’ll buy at that level because they won’t want to miss out on gains again.
This makes 3,000 an important price on the charts. A move below 3,000 could warn of a bear market.
If that happens, investors should take defensive actions. This could include selling some stock or adding put options to their portfolios.
My Peak Velocity Trader service includes a full options trading tutorial. It also gives you the opportunity to turn every $10,000 invested into $77,300 over the course of just one year. To find out more, click here.
My New Year’s Resolution
Based on the chart, we have a complete 2020 trading strategy.
Investors should own stocks until prices break above or below important technical levels. For now, the first important level is 3,000. Be defensive below that price.
Price targets and risk levels will change during the year. So my New Year’s resolution is to update this chart at the beginning of every quarter throughout the year to keep your 2020 trading strategy up to date.
Regards,

Editor, Peak Velocity Trader
P.S. After a decade of testing it in my own account, I’ve perfected my Peak Velocity Trader system. It detects exactly when stocks are about to enter “peak velocity” to reel in massive returns regardless of whether the markets go up or down. To learn more, click here.