

Has the bear market officially arrived?
For some, it arrived last year. And most of us just didn’t realize it.
The average stock price has been pummeled since then, and in certain segments it’s worse. Take shares of high-growth stocks, which typically aren’t expected to turn a profit until well into the future.
One index from Goldman Sachs hit bear market territory before 2022 even started. Over the last six months, it’s tumbled by nearly 50%:
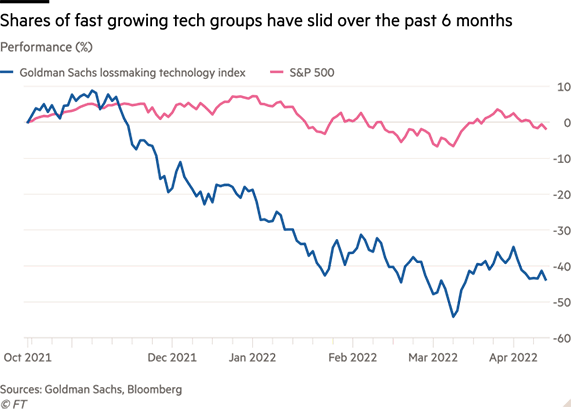
You wouldn’t have known about it just looking at the S&P 500. As you can see in the chart above, the major index has been flat during the same period, until recently.
But just in the past week, the large-cap index has quickly dropped over 5% as the pain ensnares other stock market segments.
And that begs the question: Is the rest of the stock market about to catch up to the carnage?
Here are three exchange-traded funds (ETFs) and their charts that I’m tracking to answer the question.
These 3 ETFs Are Coalmine Canaries
At first, many sectors were spared from the steep sell-off. Last year, it appeared an isolated case that expensive valuations were catching up to loss-making growth stocks.
But the pain has spread recently. A deteriorating outlook for the global economy threatens the overall corporate profit picture … from which few companies can escape.
That’s why we should look to specific areas of the stock market particularly sensitive to changes in the economic outlook. These sectors (and their corresponding ETFs) will indicate whether a bear could arrive for the rest of the market.
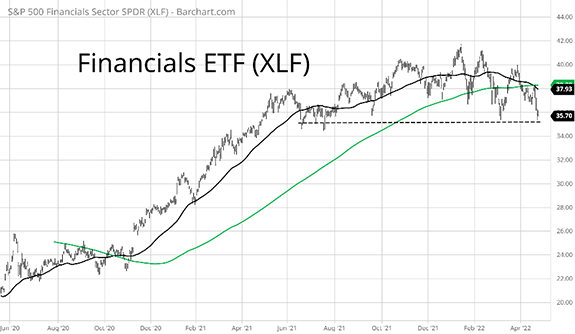
Financials
Banks are exposed to changes in the economy in two big ways.
First, if banks expect losses on loans to pick up, they have to set money aside to cover those losses … and that eats into earnings.
Second, as the Federal Reserve increases interest rates, it becomes harder for banks to make money on new loans due to a flatter (or even inverted) yield curve. The profit margin, by borrowing from depositors in the short term and making longer-term loans, disappears.
Here’s a chart of XLF. The dashed line shows the level I’m watching, where a breakdown is a clear warning signal for banks.
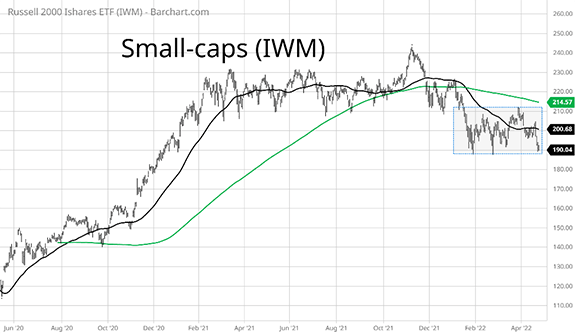
Small Caps
Smaller companies get more of their revenue from the domestic economy compared to large caps. That makes small-cap profits more sensitive to changes in the outlook for U.S activity. The IWM ETF of small caps has been range-bound since February as you can see below. But a move below the $190 support in the shaded box would be a negative signal about what lies ahead.
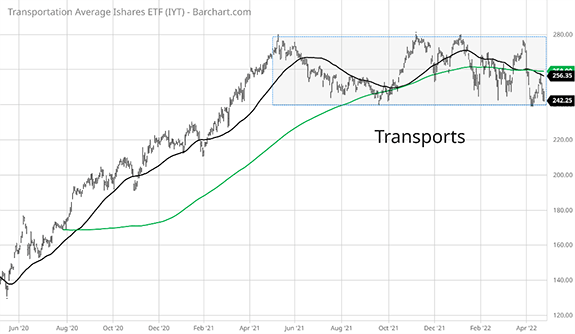
Transportation Stocks
It’s easy to understand the link between companies engaged in supply chain logistics and the economy. When it heats up, more goods are moved and demand stokes freight rates … and vice versa. That’s why I track their stock prices to see what investors are discounting down the road.
In the chart below, transports ETF IYT has been range-bound for nearly a year. A breach of support around $240 would send a negative signal about economic activity ahead.
These Charts Tell a Surprising Story
All three charts tell a similar story.
A period of sideways trading activity demonstrated a tug-of-war among investors wanting to express a bullish versus bearish view of the economy.
Now all three are trading dangerously close to important support levels … and should they give way, we may see tougher times ahead for the economy and thus corporate profits.
That’s the scenario that could deliver a bear to the rest of the market and not just growth stocks.
But even then, there’s still a safe harbor in a few key investments — specifically in income-producing real estate investment trusts (REITs). Over the past six months, one REIT ETF (IYR) has outpaced the S&P 500 by over 7%. Click HERE to view your Bauman Letter model portfolio to see the top gainers.
Best regards,

Clint Lee
Research Analyst, The Bauman Letter