
Value investors like to debate which metric is the best to follow.
Some will look at the price-to-earnings (P/E) ratio. Others prefer the price-to-book (P/B) or price-to-sales (P/S) ratio. Many prefer more sophisticated measures like the Shiller cyclically adjusted P/E ratio, or CAPE.
When looking at value in different countries, one country stands out as cheap on all measures. It’s got the lowest CAPE, P/E and P/B ratio, and the second-lowest P/S ratio.
But low ratios don’t always point to profits.
The Value Trap
Experienced investors know there is often a problem with value stocks. It’s called the “value trap” when the price doesn’t move and the investor feels trapped.
There is one way to minimize the risk of a value trap. You could wait for the price to stop falling before buying.
This isn’t as easy as it sounds. Many value investors buy stocks when they are falling. They are, in effect, trying to “catch a falling knife.”
Waiting for the decline to end minimizes the risk of buying and seeing your money trapped.
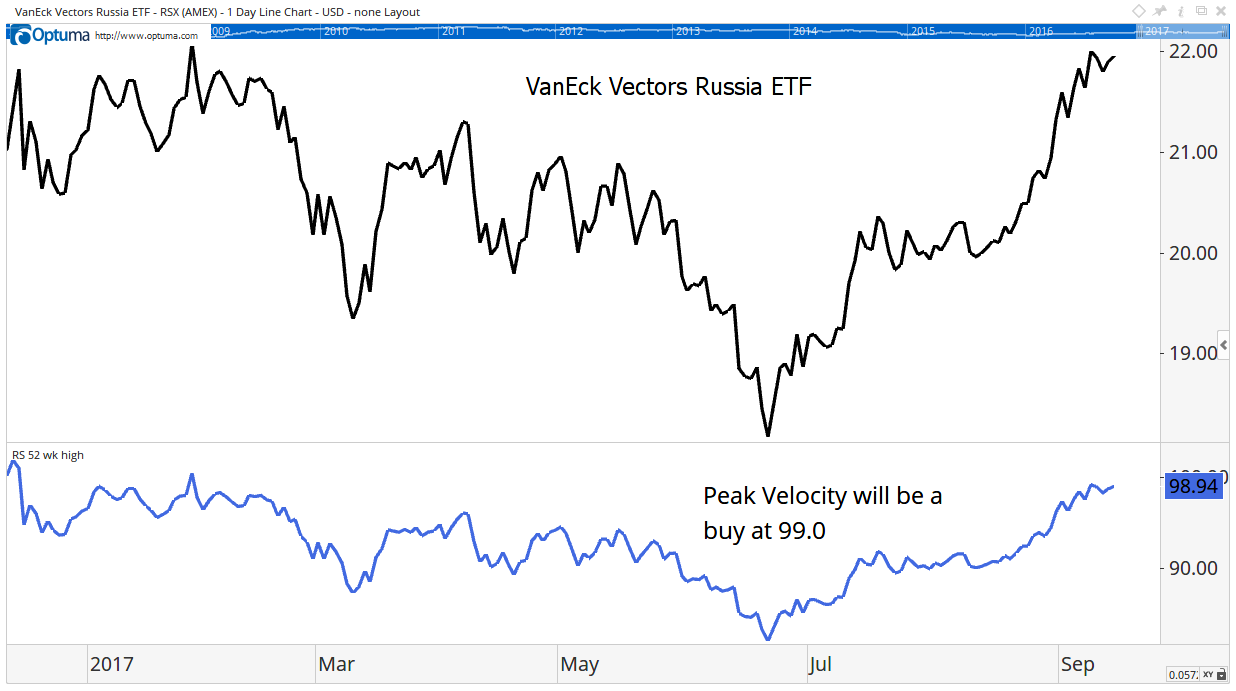
There are some momentum tools to help investors spot when a downtrend has ended. I use one called Peak Velocity.
This indicator is the closing price divided by the 52-week high, expressed as a percentage. When it’s above 99%, it’s time to buy.
Ready for Takeoff
Peak Velocity is signaling a buy in the cheapest market in the world right now. From the U.S., we can trade this idea with an exchange-traded fund, the VanEck Vectors Russia ETF (NYSE: RSX).
Russia’s stock market has a P/E ratio of 7.1, about one-third the ratio of the U.S. market. The P/B ratio of 0.8 is about one-fourth of the U.S. market. The P/S ratio of 0.7 is one-third the value of the ratio for U.S. stocks.
Many investors prefer the CAPE ratio since it looks back 10 years and adjusts for inflation. Russia’s CAPE ratio is 4.9. The U.S. ratio is 28.
The numbers all show Russia is undervalued, but is it a value trap? The Peak Velocity indicator says no.
This indicator is designed to spot breakouts in price as they develop. The chart below shows the Peak Velocity indicator for RSX is at 98.94, just 0.06 away from a buy signal.
The chart pattern for RSX is bullish, with a price target at $25.20 pointing to a potential short-term gain of about 14%. This price target could be reached within six months.
Longer term, the low valuation points to average gains of about 20% over the next three years for RSX.
This makes RSX a buy for both short-term and long-term investors.
In my Peak Velocity Trader service, I use this indicator for short-term trades that could deliver gains of more than 20% in a matter of weeks.
Regards,
Michael Carr, CMT
Editor, Peak Velocity Trader