
COVID-19 is back in the news.
This year, the disease has killed 122,000 Americans and infected 2.4 million nationwide.
It led to an economic shutdown, which sent the stock market plunging nearly 40% before a sharp rebound.
We thought it would go away this summer; but the disease had other plans.
In the past week, cases surged in the three of the most populous states: California, Texas and my home state of Florida.
On Wednesday, Florida and Texas both reported new daily records of more than 5,000 new cases. California reported more than 7,000 new cases.
New Jersey, New York and Connecticut — states that have seen cases dwindle — have now mandated 14-day quarantines for out-of-state visitors.
The stock market doesn’t like this news.
In the past two weeks, the S&P 500 Index dropped around 5% on fears that a new wave of cases will force additional shutdowns.
The governors of Florida and Texas have insisted that their economies will remain open. But even if stores and restaurants stay open, there’s still a chance people are too fearful to go out and shop or dine.
That’s why it’s important to look where everyone else isn’t to get a real-time picture of economic activity.
The Latest COVID-19 Data Is Already Priced In
Almost every economic data point is backward looking.
The government’s retail sales numbers indicate how much consumers spent last month…
And, the unemployment number tells us how many new workers were hired last month…
Even inflation data, such as the consumer price index, only tells us how much prices rose last month.
This data is as stale as the loaf of bread you forgot about in the back of the cupboard.
By the time last month’s data gets reported, the market already priced it in.
That’s why you often get a sell-the-news reaction. Large institutions are able to gain better insights than the average retail trader.
Use Alternative Data to Your Advantage
Hedge funds aren’t waiting for the news to come out. They’re front-running it by looking at alternative data sets.
They use satellite pictures of Walmart parking lots to predict sales, mobile data to see where shoppers are visiting and online surveys to better gauge business spending on capital goods.
There’s one alternative data set I’ve been closely monitoring during the pandemic. This one tracks restaurant reservations on OpenTable, a smartphone app that allows diners to secure a seat in advance.
Here’s the chart of year-over-year OpenTable data for Los Angeles, Houston, Miami and New York City:
OpenTable Reservations in Major U.S. Cities
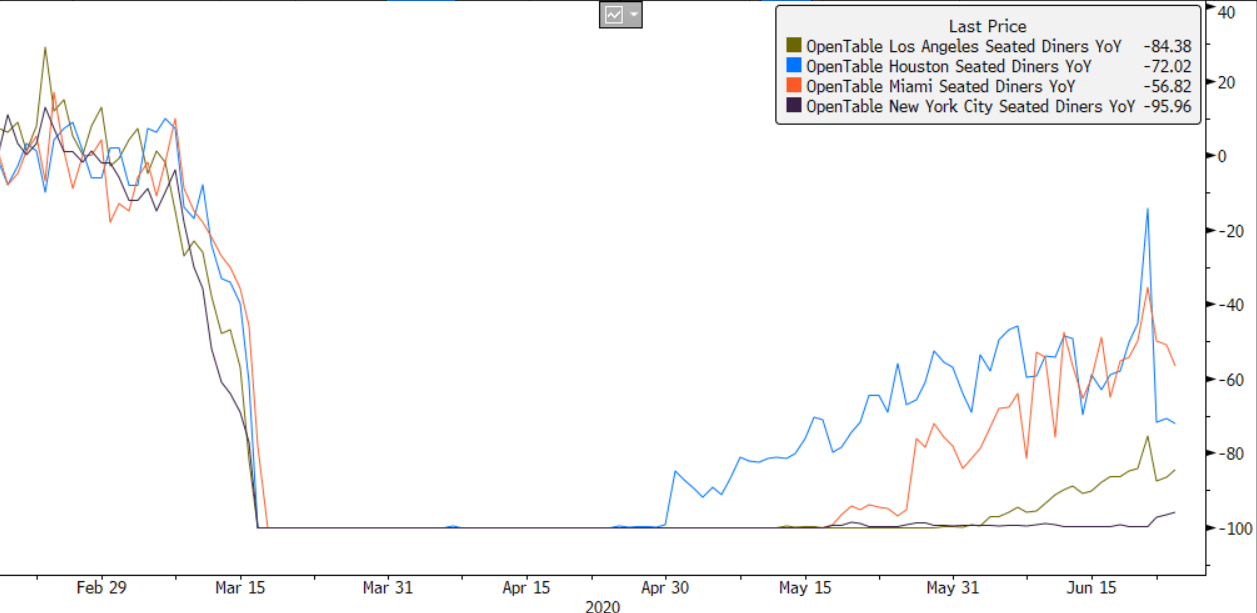
The chart goes back to early February, a month and a half before everything was shut down.
It’s clear that diners became concerned in early March about the coronavirus, even though restaurants in these cities were still open. That’s when the year-over-year numbers started falling.
Seated diners registered a 100% drop in mid-March when the shutdown took effect. The economy was shut down, and restaurants weren’t open during this time.
Houston emerged first at the end of April, followed by Miami and Los Angeles in mid-May. New York City lagged as the city hardest hit by the virus slowly reopened.
In the past week, those rising numbers have started to decline. I have concerns that even though states may stay open, people may still choose to stay home.
This is negative for the economy. It would lead to slower growth and has the potential to send the market plunging again.
We wouldn’t have to wait for the government to release its data on this, though. We can see it in real time with OpenTable’s numbers.
Regards,

Editor, Automatic Fortunes
P.S. This is just one kind of alternative data set I track in my Automatic Fortunes service to help give readers an edge. Click here to find out more.