In April 2009, I sat down with my partner in money management for our monthly review of market risks.
April 2009 was, of course, the beginning of the next bull market.
We didn’t know that at the time. All we knew the S&P 500 was 20% above its lows. And that the rally was only a month old.
I said one risk was that traders were “over their skis.” They were, in other words, getting ahead of themselves.
He agreed. So we developed a plan to tighten our stops in case prices reversed to the downside again. We would participate in the rally if it continued, and save our investors’ capital if it didn’t.
After the meeting, we went to lunch. He brought up that “over their skis” phrase … and his problem with it.
As an avid skier, he said there’s no such thing as being “over your skis” when you’re skiing. The whole idea doesn’t make sense.
The term originated in finance, not the slopes. He thought it likely came from a non-skier trying to sound cool in a Wall Street conference room.
No matter where the phrase came, we use it to describe situations like we’re in now. Stock prices are “over their skis.” Detached from the fundamentals. Dangerously so.
And I’m not talking about just the bloated tech companies shedding their workforces.
The entire S&P 500 valuation is not in line with economic reality.
Here’s why…
The Problem in Two Lines: 2023 Earnings Estimates
The problem with stock prices right now comes down to earnings estimates. All we need is two lines to see the problem:
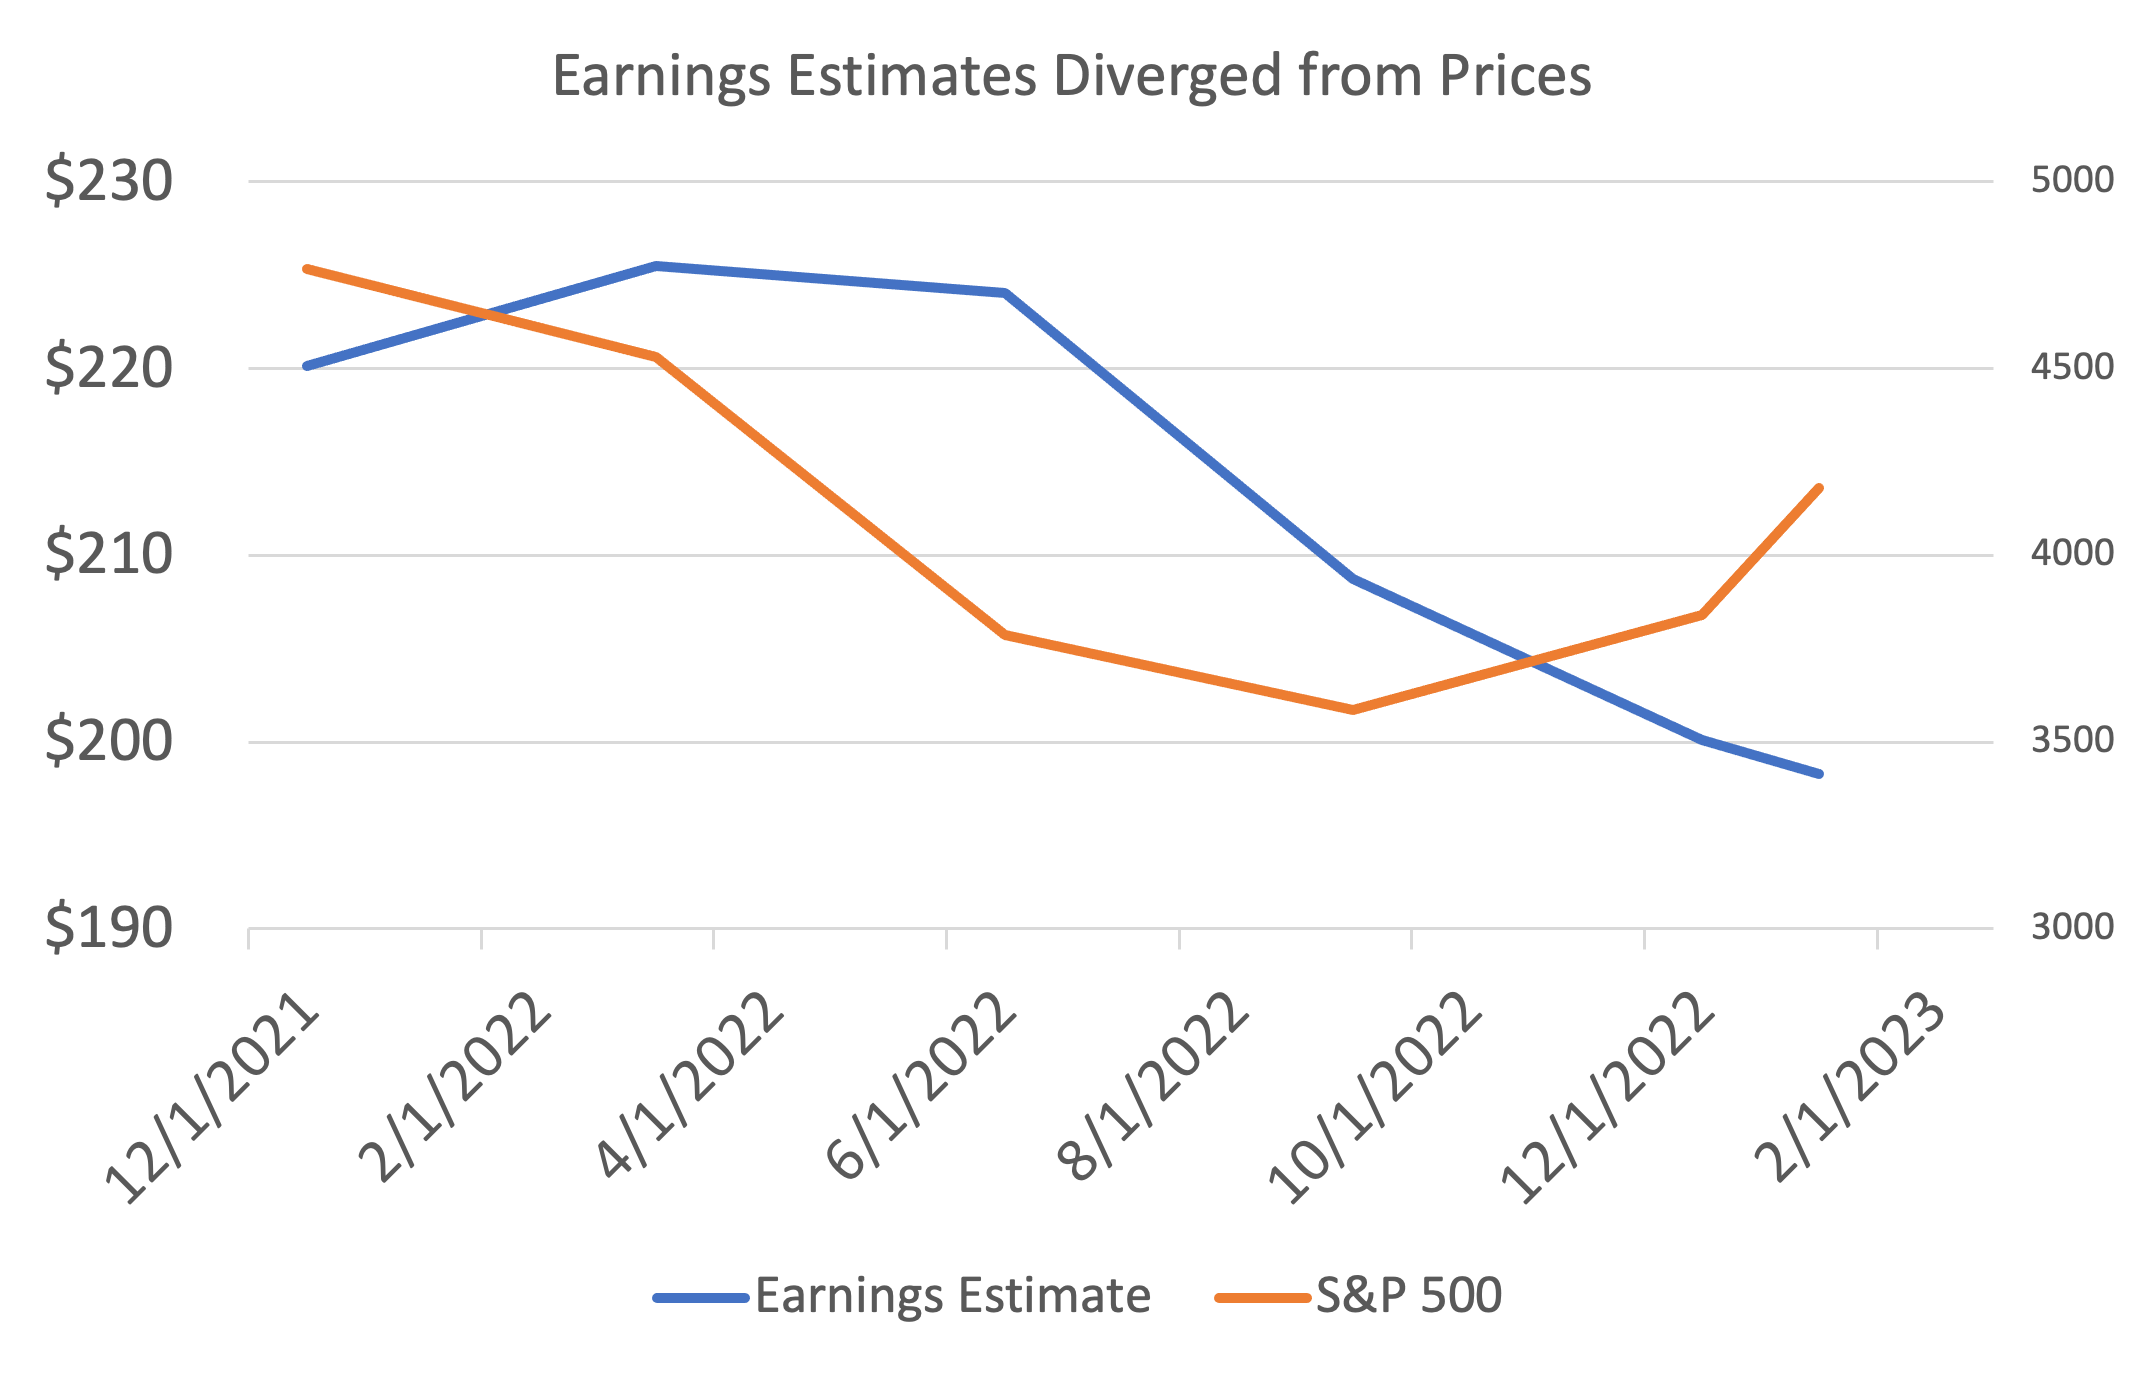
In the chart, the orange line shows the S&P 500 (right axis).
The blue line shows earnings-per-share estimates (left axis). Each month’s estimate projects the average of the next 12 months.
All we need to know with this chart is this…
During January, stock prices soared as earnings estimates fell.
That could make sense if interest rates are falling. Lower rates make a dollar of earnings more valuable. But rates were rising in January, and going off Jerome Powell’s comments this week, they’re set to continue rising.
A deeper look at earnings shows how far traders are “over their skis.”
In 2022, earnings for the companies in the S&P 500 were about $198. That’s down 4.7% from 2021.
In 2023, analysts are expecting earnings of $221. That’s a 10% increase.
These same analysts also expect a recession in 2023.
So… Somehow these analysts’ models say earnings will grow 10% in a recession.
That’s never happened before. Earnings fall an average of 20% in a recession.
Safe to say, I think this earnings optimism is misplaced. Consumers are cutting back as inflation limits buying power. Higher interest rates mean it’s less likely consumers will make large purchases.
These trends will hit companies’ revenue. Lower revenue means lower earnings, and make no mistake, that will impact stock prices.
And we can’t forget the biggest headwind to stocks that hasn’t gone away: inflation.
Don’t Kid Yourself, Inflation Is Not Gone
Another challenge for earnings is the impact of inflation. The amount companies are spending on inventory is rising faster than sales. This reduces profit margins.
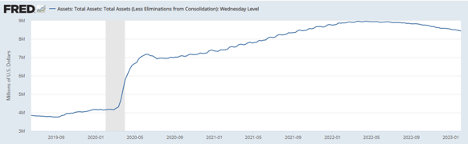
Jerome Powell noted last week that interest rates are having a “disinflationary” impact, which is true. But one needs only look at the magnitude of the Federal Reserve balance sheet to understand that the Consumer Price Index won’t hit 2% again anytime soon.
The Fed balance sheet is my preferred inflation metric because, as Milton Friedman explained: “Inflation is always and everywhere a monetary phenomenon, in the sense that it is and can be produced only by a more rapid increase in the quantity of money than in output.”
Friedman meant that when the money supply increases, that money has to go somewhere. If the economy expands as fast as the money supply, the money goes to goods and services. If not, we have more money chasing the same amount of goods and that is all inflation is.
The Fed’s balance sheet is one measure of how much money the Fed created. That balance sheet increases because the Fed is lending money to banks and large Wall Street firms. Banks use that money for loans. Those loans create additional money.
The balance sheet expanded by $4.7 trillion after COVID. If banks lent 85% of that, a conservative estimate, that created over $39 trillion of money for the economy to absorb. That created inflation.
Now, the Fed is withdrawing money. That will cool inflation, but this is a much slower process than investors assume.
The Fed’s balance sheet is just 5% off its highs and slowly inching its way down … after doubling in the two years after the pandemic began.
To think that we’re out of the woods on inflation is far too premature.
And in this inflationary environment, earnings are more likely to fall than rise. An optimistic forecast is for a small drop to $190.
When short-term interest rates are near 5% as they are now, the S&P 500 has historically traded for about 19 times earnings.
That provides a price target of 3610 — more than 10% below the current price.
If earnings fall 20%, the price target for the S&P 500 is 3000. That seems extreme… But it’s possible.
In that hypothetical world where skiers get ahead of their skis, we imagine they are in for a dramatic spill. Something like the old “agony of defeat” footage from ABC’s Wide World of Sports.
Traders might be facing that agony in the next few weeks. Prepare your portfolio for a potential unwind from the January rally.
Regards, Michael CarrEditor, One Trade
P.S. Adam O’Dell, who you’ll be hearing from directly tomorrow, is also skeptical of the January rally we just saw.
He thinks there’s another shoe to drop. And he’s not shy about taking advantage of it with a low-risk, high-reward trading strategy you probably haven’t heard of before.
Adam’s going live with the full details next week, where he’ll reveal what types of stocks he’s targeting … and the methods he’s using to profit off them.
You can sign up for the event right here.
Market Edge: Newsflash — the Yield Curve Is STILL Inverted…
It’s been an interesting few weeks. Fed Chairman Jerome Powell breathed life into the market by commenting that disinflation appeared to be taking hold. That’s exactly what investors wanted to hear because the sooner inflation drops off, the sooner the Fed can stop hiking interest rates.
But as more data rolls in, it seems we’re still showing signs of overheating.
There were 517,000 new jobs created in January … not exactly a number you’d expect to see in a cooling economy. The unemployment rate is at its lowest level since the 1960s … and this is despite months of high-profile layoffs in the tech sector.
The joke on Wall Street is that disinflation could prove to be “transitory,” mocking Powel’s comments from 2021 that the inflation seen at the time would quickly pass.
We’ll see.
But it would seem that the bond market still sees pain ahead.
The yield curve is massively inverted right now, as it has been for months.
An inverted yield curve is when shorter-term yields are higher than longer-term yields.
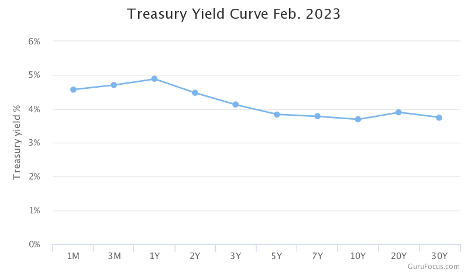
This isn’t normal, of course. Longer-term rates should always be higher than shorter-term rates given the higher risks involved.
And you certainly see this in your daily life. Have you ever seen a 30-year mortgage with a lower rate than a 15 year?
An inverted yield curve is a sign of distress. The bond market is telling us that it expects growth to be slower ahead. And historically, every time we’ve seen an inverted yield curve, a recession followed on a fairly short timeline.
Now, it’s possible this time is different. The first and second quarters of 2022 saw mild GDP shrinkage, which is the classic definition of a recession. It’s possible we’ve already had our recession and that what we’re seeing today in the bond market is some sort of strange post-pandemic aberration.
Maybe.
But my interpretation here is that the bond market expects to see the Fed continuing to push rates higher until something finally breaks.
In the meantime, it pays to be flexible.
Make sure that any new buy-and-hold investments are stocks that you’d be willing to hold through some rough times. But this is also a great environment to be a short-term trader.
My good friend Adam O’Dell devotes his research not just to uncovering great stocks, but also finding the ones that have little hope for survival.
These stocks present just as big an opportunity, if you know the right way to play them.
Adam’s calling this his “Big Short,” but really, it has nothing to do with shorting at all.
He’s found far less risky, and far more profitable, ways to make money as these companies collapse.
Go here to sign up for Adam’s big event next week, where he’ll share details about his next Big Short trade and how you can get involved.
Regards, Charles SizemoreChief Editor, The Banyan Edge