Welcome to my first issue of Winning Investor Daily. I have been writing to you through the Sovereign Investor Daily newsletter for almost three years now, and you can still expect the same expert insight, in-depth research and profitable opportunities that I have been sharing with you over this time. The only differences are that now you will be receiving even more expert analysis, and, as JL Yastine mentioned last week, you can look forward to Winning Investor Daily landing in your inbox every day around 10 a.m. Eastern time.
I fall into what is considered the millennial generation, reaching my early adult life in the 21st century. That means trends and items that are pre-2000 are considered ancient, as I didn’t live through them. For me, computers have always been ubiquitous, the Internet was always there for research and cat videos, and few of my generation have ever used a payphone because … well, we all had cellphones.
Maybe that’s why when I hear our newly elected President Donald Trump boast that the U.S. should easily have a 4% or more gross domestic product (GDP) growth rate for the first time since Bill Clinton was president, I have no past experiences to draw on to understand what that kind of economy would look like.
So, using 21st-century computing power to analyze data sets over the last 30 years, I dove in with the intent to uncover how the market performed during periods that experienced robust 4% growth. And this look back can show what we have to look forward to in the coming year and how you can profit…
America’s Growth Dilemma
In 2000, we survived the infamous Y2K bug, the dot-com bubble bursting and the Florida presidential vote recount that handed George W. Bush the presidency over Al Gore. We also had Vladimir Putin sworn in as president of Russia, the U.S. jobless rate hitting its lowest level since 1970 and the human genome deciphered.
It was also the last time the U.S. posted growth that topped 4%.
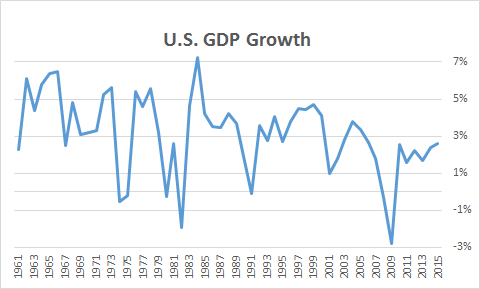
In the past decade, the U.S. has averaged just a 1.43% GDP growth rate — a far cry from Trump’s 4% campaign promise. Take a look at this chart of past annual GDP growth rates since 1961. As you’ll notice, America’s growth is on a steady downward path.

Despite the downward momentum that seems to be building, it’s important to note that 2015’s GDP growth was 2.6%, up from 1.67% two years before. We are clearly on an upward path — at least in the near term — that puts 3% a chip shot away and 4% within arm’s reach.
So what, historically, has performed well during a 3% to 4% growth world?
To answer this, I looked at growth rates that topped 3% since 1985.
Winning Assets to Watch
In analyzing the results, I focused on the years that were solely above 3%, eliminating any growth rates below that. In total, I found 14 instances out of the past 31 years where U.S. GDP growth topped 3%.
And the results really speak for themselves…

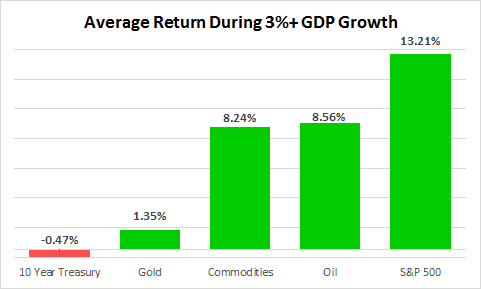
Clearly stocks are the way to go. The S&P 500 Index posted a whopping 13.21% average increase during years where the U.S. GDP growth rate topped 3% — which, if Trump has his way, will happen in 2017.
Oil and a basket of commodities also performed well, averaging a little over 8%.
But two assets you want to avoid when GDP growth is strong are gold and bonds, as both vastly underperformed the broad market.
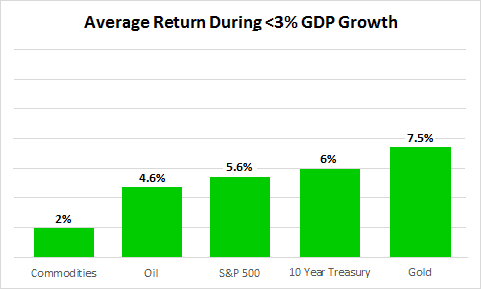
Likewise, I also looked at the environments when U.S. GDP growth was under 3%…

Gold (7.5%) and bonds (6%) were the two top-performing asset classes. Stocks (5.6%) came in a close third, and oil (4.6%) and commodities (2%) brought up the rear.
Beating the Market
However, Trump comes with a great deal of uncertainty, which will likely show itself more as he heads down the enduring path of getting policies implemented.
And for that, it doesn’t hurt to have timely guidance from our other experts and me to keep you on top of the latest market developments.
Regards,
Chad Shoop, CMT

Editor, Automatic Profits Alert


