
In today’s Your Money Matters, Clint Lee and Ted Bauman review the stock market’s terrible start to 2022. But a bad start doesn’t always mean a bad finish — just ask the tortoise about his race with the hare.
A big question, though, is how to know when the market has reached the short-term bottom.
If you can spot that, you can grab the opportunity to ride it back up to whatever level it’s going to achieve later on.
Clint explains how you can identify that opportunity using easily accessible technical indicators … and why it’s so important to wait for confirmation of a rebound before jumping in.
Click here to watch this week’s video or click on the image below:
Transcript
Ted:
Hello, everyone. It’s Ted Bauman and Clint Lee here with your Your Money Matters for this week. Just as a reminder, we do this as part of the Bauman Daily, which is a free offering that we basically put out an email or video of most days of the week. But our big thing is The Bauman Letter. And if you’re interested in subscribing to that, you can click on the little “I” that’s in a circle up in the upper right-hand corner of your screen. And there you can get an opportunity to subscribe to The Bauman Letter and see what we do. And remember, there’s no risk. If you don’t like it, you can get your money back right up until the last minute of the last hour of the last day of your free one year, or not free, but your one-year money back period.
Clint, are people going to make money back in the stock market this year?
Let’s have a look at what’s going on. Basically, we’ve seen just a lot of headwinds at the beginning of this year. That’s no surprise. Analysts have cut forecast growth for the first quarter, from 2.3% annualized down from 4.2%. So clearly, it’s not just interest rates that are worrying the market. There’s also some potential of the Fed tightening into a slowdown. And one of the reasons for that slowdown could just be that people don’t have money anymore because the child tax credit wasn’t renewed. Federal transfers are ending. People have spent their “stimi” money. So, things are not looking good.
Here’s a chart that shows that the S&P’s 11% drop in the first 16 trading days of the year is the worst ever, folks:
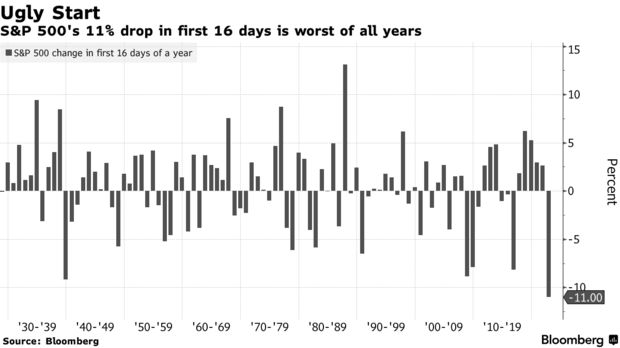
If you were thinking this was a bad year, you sure got it right. This is the worst-ever start to a year. And that meant, here’s the second chart:
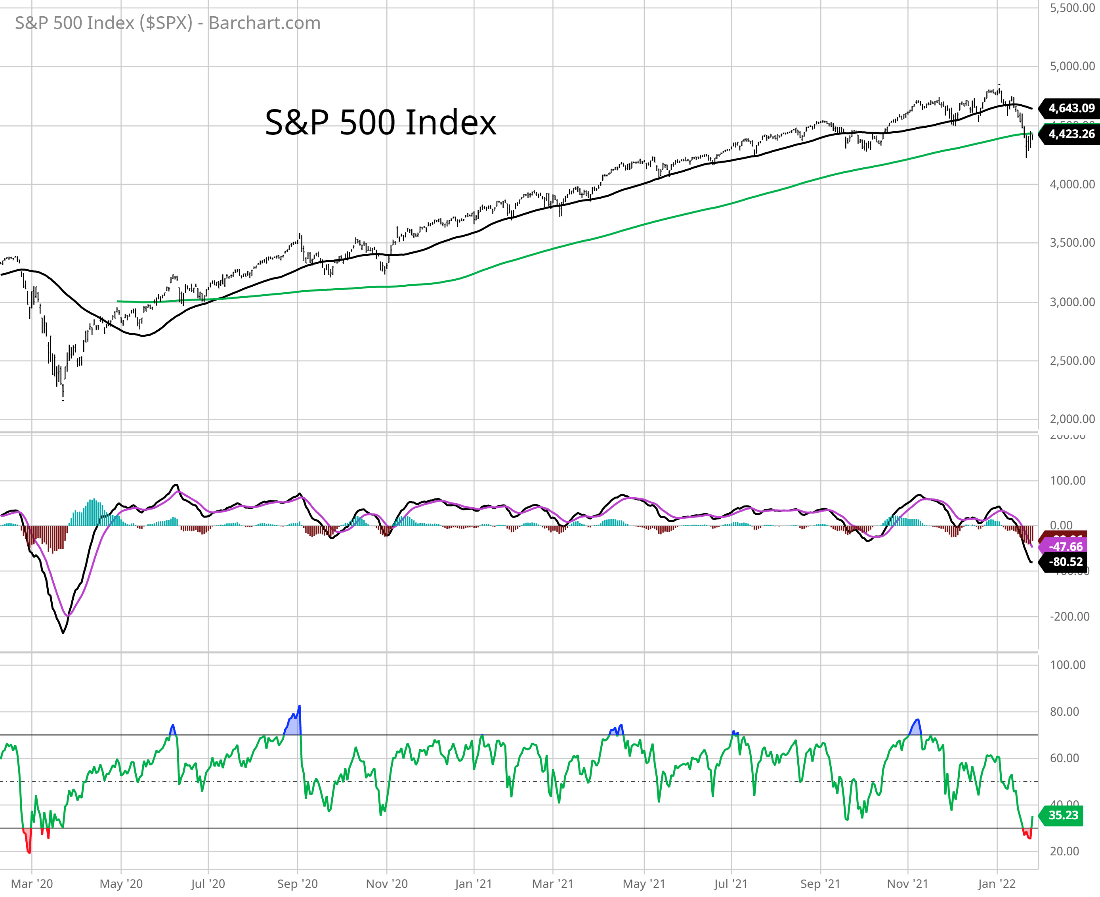
The S&P broke through its 200-day moving average for the first time since the pandemic struck. You can certainly see the momentum indicators in the bottom right-hand corner, rolling over pretty dramatically to levels we haven’t seen since back then when things started.
And of course, the heaviest carnage has been in the so-called meme stocks. I prefer to think of them as momentum stocks. Here’s the economist’s take on it:
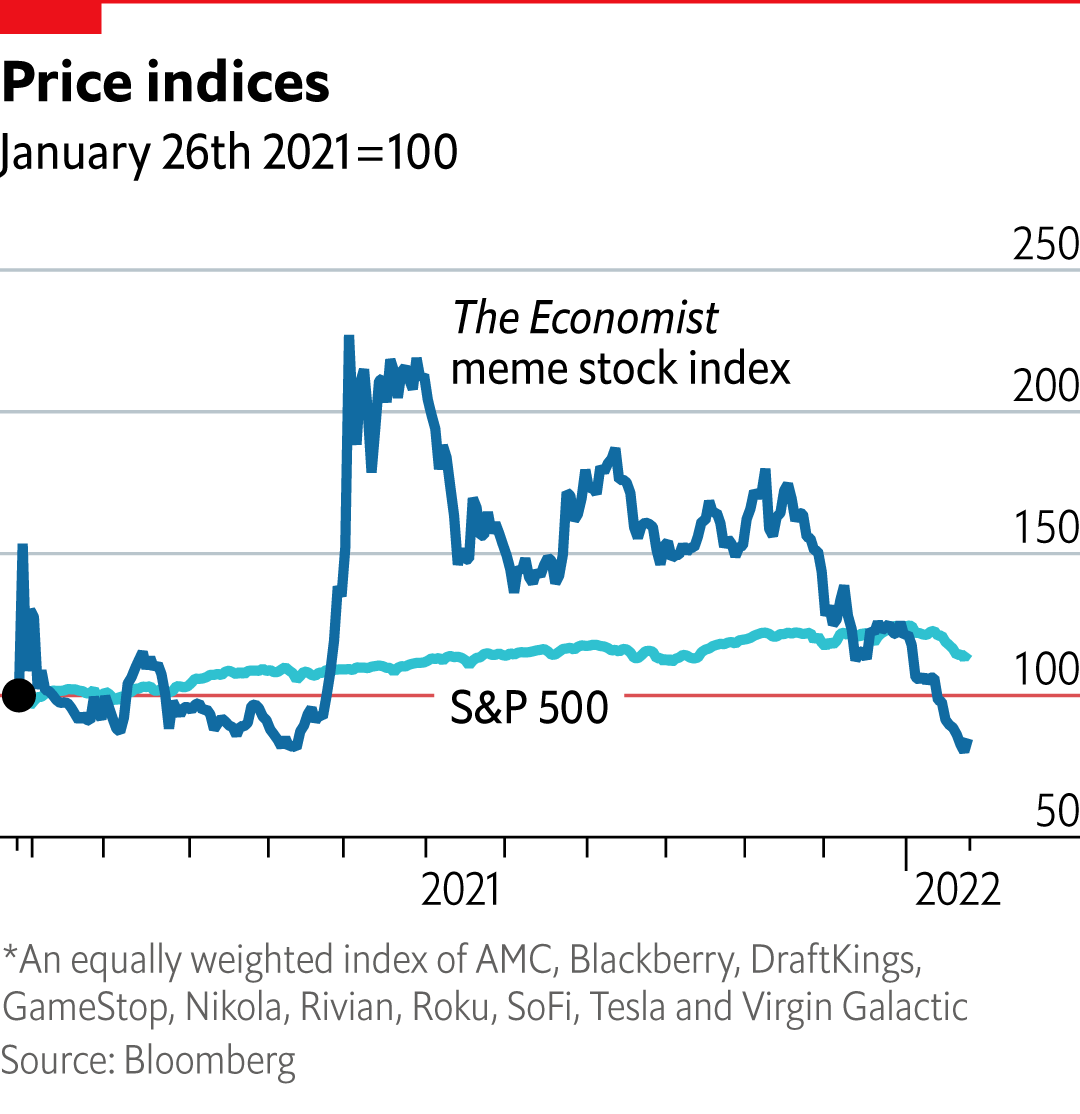
It’s an index that they put together. You can see at the bottom what it covers, but basically that’s the story, I think, that a lot of people, particularly those who are new to the market, have never seen a big turnaround like this. That’s got to hurt. I know that I’ve been accused of picking on these kind of meme stocks, but the reality is that at this point, you have to decide which companies to invest in.
Clint:
Every week, every week you’re picking on meme stocks or ARK. Come on.
Ted:
That’s right, yeah. I’m the anti-ARK. But look, here’s the thing… Since 1980, the S&P has been up 60% of the time in January. And when it is, the average gain for the year that it’s up in January is about 50.5%. It’s down 40% of the time. And when it is, the average gain is just 3.6% for the full year. So in that kind of a context where history says we’re heading for trouble, what should investors be doing to make the best of it?
Clint:
Well, I think it’s definitely going to be different than what a buy-and-hold investor has been used to since the pandemic started or even used to since, the last decade or so. With the market we’re getting into, I think you’ve got to start to adapt to more of that tactical mindset, that opportunistic mindset. Because there’s going to be a lot of great opportunities, but there’re going to be more trading opportunities. And so, if you can have that mindset, you’ll still be able to find some great opportunities, despite all the volatility that, as you pointed out, we’ve already seen this year.
So, how do you find those opportunities?
Well, I think one of the things to keep in mind, and this kind of comes down to the core of my philosophy, at least, of the markets, and it’s “Everything is mean reverting,” whether it’s: stock prices, valuations, investor mood, how people feel about the market… It all gets stretched too far in one direction and tends to snap back. The extremes of that is complacency. On the other end, it’s capitulation or panic. And so right now, there’s several signs we’re seeing that it’s the capitulation, the panic, finally setting in with the sell-off. And that’s what I like to look at.
I like to look at a couple different areas of the market to construct that overall picture of what we’re seeing. And then you look for confirmation of that. I want to take you through, today, just a couple of things that I’m looking at, kind of what they’re saying right now and then how you can act on them, at least on a short-term trading basis. One of the things that you can use to track sentiment of the market and some other things, is volatility itself. Everyone’s probably familiar with the VIX Index. It’s the fear gauge. It measures implied volatility on the S&P 500. And because prices tend to go down faster than they go up, when things are falling, the VIX spikes.
Well, you can track, the volatility of volatility. It’s something I wrote about actually in Bauman Daily for this week. And here’s a chart of that:
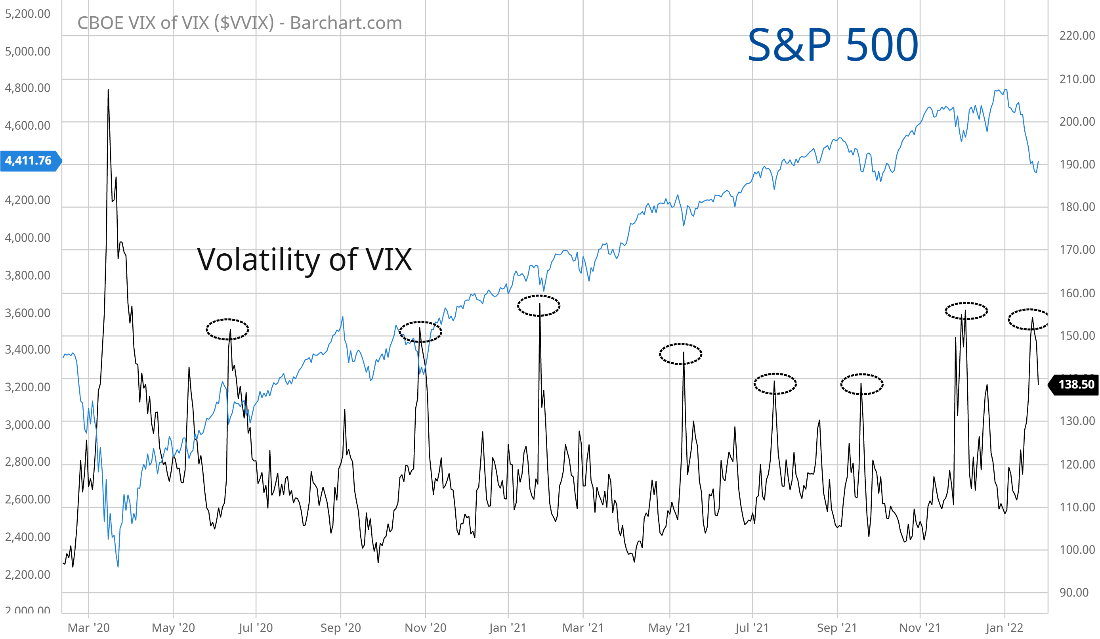
And I want to show you what I mean by this, because this can be a great early warning kind of indicator that the VIX is peaking out and about to roll over. So this shows that volatility of the VIX Index, if you go out to like Barchart.com and punch in VVIX, you can bring this up.
I took this back to the start of the pandemic, and I circled all these spikes in this major on here, the black line on here. You can see these spikes and that overlay with the S&P 500 have tended to coincide with a sell-off in the market kind of reaching its peak. And look at what’s happening just recently on the right-hand side here. We had this peak out, and we’re already starting to see it roll over. So that’s kind of an early warning sign to me that you’ve seen the VIX peak out.
The implication here is that there’s a lot of institutional money managers that use volatility to manage their investment portfolios. When things become more volatile, they sell stocks and that creates more selling pressure, but that can work in reverse, too. As volatility calms down, that’s a signal for them to buy stocks, and they can push prices back up, once again, just with swinging their money around the market. That’s one thing to keep an eye on.
Another sign of capitulation. You talked about, you showed that chart of the S&P with the 200-day moving average, and you had those technical indicators in there. A lot of people talk about overbought and oversold as it pertains to a stochastic or the RSI, or one of my favorites, the MACD. But when it comes to tracking, wanting to see that capitulation level, you want to look across the market, what stocks are doing relative to their own trends. And so, one of my favorites to track this on a shorter-term basis is the number of stocks trading above their 20-day moving average. And we’re hitting some extreme low levels on that right now. So, here’s a chart of that:
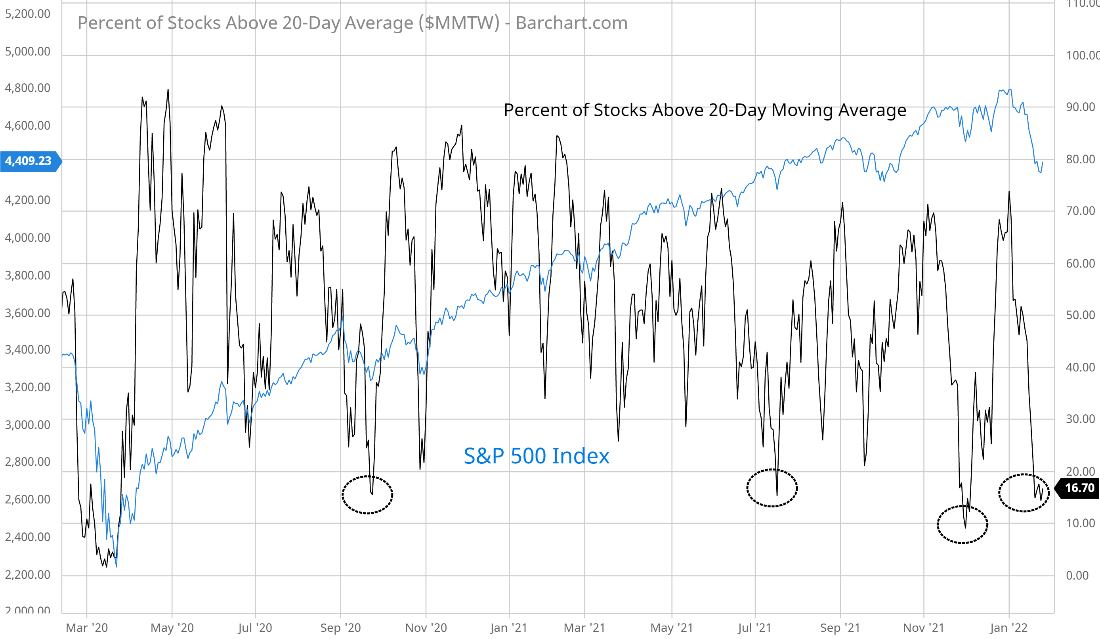
And I took this back to the start of the pandemic as well, just so you could see how infrequently we hit these extreme low levels. So the black line on here, that’s the percent of stocks above their 20-day. And you can see that right now, only about 17% of stocks across the entire market are trading above their 20-day moving average. And as you can see in these prior instances, once you start to get below that 20% threshold, that’s an extremely oversold level. A lot of times on here that’s marked the end of a sell off.
Now, the last sort of confirming indicator that I look at with this, some majors of volatility, majors of how stocks are trending. Well, how does investor mood look right now? And once again, this is another area where we’re seeing a capitulation on the fear side. Here’s a chart:

I saw this on Twitter actually from MacroCharts, they take and they plot out the percent of bears based on this survey that the AEII does of individual investors. So just asking them how they feel about the market. And then they plot out the percent that’s bullish or bearish … and so on.
So, the red line on here in the middle, this is the percent that’s bearish, and you can see this moving higher. We’ve got the highest level of bearishness in the stock market in quite some time. I mean, maybe almost back to the 2008 financial crisis. In the bottom panel, they take the bull-bear spread, so what’s the percent bullish versus bearish, and just in that altitude, and once again, just at a very low level. So it’s just all that extreme fear that’s out there. So deeply oversold, extreme fear, topping signs on the VIX. That tells me there’s a lot of capitulation out there, and that this is an area to look at to play a potential bounce here.
Ted:
Basically, what you’re saying is, what you’ve just given us are ways to sort of, in a sense, call a bottom. When these things start to reverse convincingly with confirmation over a couple of trading sessions, then that’s the time to start looking for opportunities. But the question is, what would be the signals that you would use in order to decide to get back in? Then we’ll come back to what kinds of things to get back into. But how do you look for a confirmation that things are rolling over and back up again?
Clint:
So once again, these are things we’ve talked about. I mean, it’s looking at the shorter-term trends in the market. And so to confirm that, to confirm that we could see a bounce on full here over the next at least several weeks or a month or so. I would look for price itself to confirm … and move higher. There’s a couple different ways that you can do that. So specifically, to how we’ve seen the market trading just recently, if you look at S&P 500 index futures, I like to track the markets using index futures. Just over this past week, we’ve been stuck in this range. There’s been a lot of big ups and downs, but it’s really been range bound. It’s been, looking at my notes here, 4,250 on the downside to 4,450 on the upside.
And so, what I would look for is that 4,450 on the upside, if we can start to see a breakout over that level, once again, that’s price confirming that we might have a bottom in place, at least over the near term. Another thing you can look at is, you flash how the S&P had broken below its 200-day moving average. Well, it’s been basing right below that 200-day moving average, the green line that was on that chart. That’s another confirming indicator you could use, if we can see a daily close back above the 200-day, that could be a confirming indicator, as well.
And then the other thing I would say is just, look for the character of the market to change. And so, you might say, “What in the world are you talking about, the character of the market?” Well, what we’ve seen a lot with this sell-off, and what you see in weak markets, bear markets, is that stocks tend to open the trading session strong and close weak. We’ve seen that several days this week, we’ve seen these strong opens that just get sold throughout the day. And you want to see the opposite of that. It doesn’t matter if it’s a weak open or a strong open, you want to see a strong close. We saw initial signs of that.
Ted:
We’ve seen some of that last week and on Monday as well, right?
Clint:
Yeah. Markets were down nearly 4%. The S&P was down nearly 4% at one point on Monday, and then came back to close the session slightly green. That was potentially the start of the market starting to change its character. We just haven’t seen that follow through once again. Specific to what we’re looking at right now, if we can see a strong close and get above that 4,450 level, that would be a good thing.
Ted:
Right. So just to recapitulate here, basically, the critical thing is we’re looking for signals that the market has had enough, that it’s shaken out whatever it wants to shake out, and that it started to go back up again. But one of the things you mentioned earlier, I think is an important thing to remember, is that there’s a lot of stuff that goes on in the market that is really related to big institutional trading around volatility, and particularly around options and hedging. And you really want to be careful to make sure that you get solid confirmation of a reversal in the downward trend, because they can give you false signals. We’ve seen that before.
If volatility stops, if it falls, then these guys buy because mechanically that’s what they’re going to do. It doesn’t necessarily mean that the whole market has turned bullish, just that a big chunk of it is going to buy at lower volatility and vice versa. So you want to look across the board. But the big question is, no matter what the whole market does, where should investors be looking to buy stocks? Clearly you can’t just buy any old stock, so where should they be looking if the market does turn around? What are the best bets?
Clint:
I think there’s a couple areas you can look at. One, we’ve seen cyclicals and value areas of the market leading this year. And in the aftermath of the Fed, we’ve seen 10-year Treasury yields starting to back up again. That’s one thing that was benefiting that rotation into cyclicals and value. That’s if I want to add to maybe something I’ve got a little bit of a longer-term horizon on. If I’m looking to play sort of this shorter-term opportunity, I would look at some of the areas of the markets that have been the most oversold.
You could even look at an ETF like IWM or QQQ, and manage risk by trading options on those ETFs. You can pick up call options going out a couple months with a strike that’s somewhere near the money, or maybe just slightly out of the money, but that’s a great way to, if you’re uncertain about this environment, you don’t like the volatility, you can control your risk because you know however much you spend in those premiums is exactly how much you would stand to lose, no more than that.
Ted:
I like your emphasis on trading ETFs, because I think one of the things about a market like this is that you just never can tell which individual tickers are going to stick with the trend because every company’s got its own idiosyncrasies. But if you can spot something that says, “Hey, like commodities? You could buy GSG.” That’s an ETF that’s based on commodity futures. And if you do that and commodities are strong, buy the ETF. You don’t have to go messing around buying gold miners or buying middle ERPs, or any other kind of big commodity-related companies.
Buy the ETF, until the market’s got clear direction and you can see through the haze and say, “Hey, these particular companies are the ones that are going to do best.” But I like what you said just now about if you have long-term investment ideas about a company: Have a shopping list. When a company gets seriously oversold relative to trend but there’s nothing wrong with the company, buy it. We’ve just done that, actually, at The Bauman Letter. We bought a company that had been beaten down quite substantially, actually, since mid-December, for no obvious reason, just because it’s going along with the rest of the market. But its fundamentals are so much better than everybody else’s that I think it’s going to actually double or even triple the market this year, simply because we bought it at an attractive entry price. So that’s the plan.
Clint:
And it has a nice yield.
Ted:
And a yield, of course. That’s why it’s attractive. Companies that produce a dividend yield, they’re going to be rewarded because that’s what the market is after. They want real, and cash is real when it comes to dividends and things.
Anyway, folks, that’s all for us this week. We’ll see you again next week. I will be reporting from South Africa next week where I’ll be, but I’ll be here with Clint, we’ll just be very far apart, that’s all, or at least farther apart than we usually are.
Clint:
Right.
Ted:
Anyway, we’ll talk to you next week, so bye-bye!
Good investing,

Angela Jirau
Publisher, The Bauman Letter