
Generally, when I get an instant message from Joe Hargett, it’s to remind me of a deadline.
Joe is my editor here at Banyan Hill. He’s my writerly conscience. (He’s also a crackerjack technical analyst and regular contributor to Sovereign Investor Daily.) Like any writer, I have a healthy fear of him.
The Current Stock Market Meltdown
During the market meltdown Friday morning last week, Joe sent me an instant message.
I became instantly nervous. What had I forgot?
“Nearly every stock I’ve looked at this week is trading overbought (i.e., 14-day RSI above 70), and has been for more than a week. Wondering if there is a filter we can use to see how many S&P 500 stocks are overbought.” (RSI means Relative Strength Index, a key measure of a stock’s upward momentum.)
OK then. I hadn’t forgot to submit something. Whew.
But Joe had hit on something. Within minutes, I’d run the filter in question. Joe was right: A sizable chunk of the S&P 500 had been rising much faster than usual … nearly 40% of firms in the index in late January.
That got me thinking. What do historical fluctuations in the proportion of S&P 500 firms with high RSIs tell us?
What I found is ominous.
Too Much of a Good Thing
Sometimes, momentum is a bad thing … too much of it suggests the market may be irrationally optimistic. A historical look at RSI suggests this is one of those times.
The Relative Strength Index (RSI) of a stock compares the magnitude of recent gains and losses over a given period — 14 days is most common. Fundamentally, it measures a stock’s momentum, whether up or down.
Technical analysts use RSI to assess whether a stock is becoming overbought or oversold. RSI values of 70 or above suggest a stock is becoming overbought or overvalued, and therefore at risk of a correction. An RSI of 30 or below signals the opposite — oversold or undervalued. It might be a profit opportunity.
The key term is “becoming.” RSI measures the velocity of change in the average price of a stock. When RSI is high, it means there is an unusual amount of buying activity over a given period compared to “normal” conditions.
How Big Is the RSI Party?
There’s nothing unusual about a high RSI for an individual equity. For example, when the market learns a company is a merger target, buyers want to own its stock before it happens, leading to a high RSI.
Similarly, we might see high RSI measures for a group of stocks in a sector — energy, for example — when the market thinks that sector is going to boom.
But given that there are 500 individual firms in the S&P 500, covering all sectors of the economy, it’s unusual for a big chunk of them to enjoy a high RSI all at once.
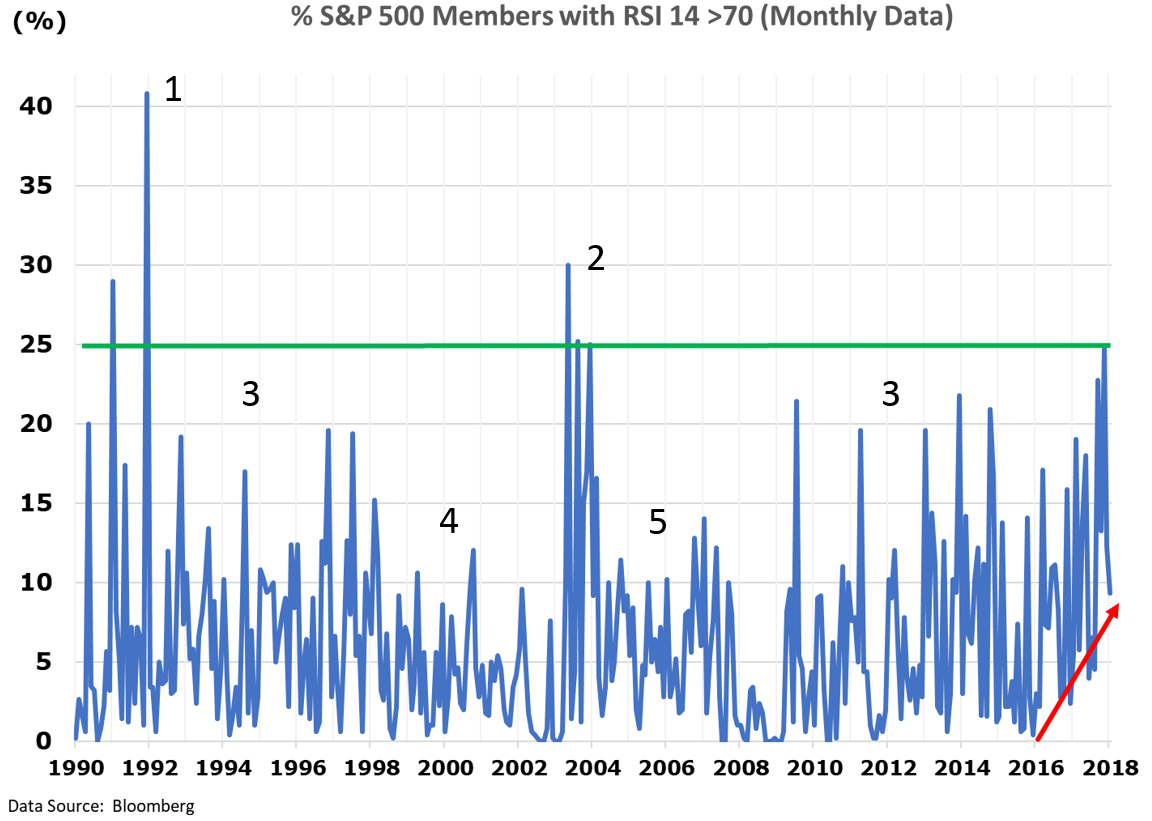
The chart below shows the percentage of firms in the S&P 500 whose average RSI was over 70 in the previous month, from 1990 to today. I’ll call it the “market RSI” level.
The median figure seems to be between 5% to 10%. But the market RSI level can go much higher.
For example, after the recessions of 1990-1991 and 2001-2002 (1 and 2 below), 30% to 40% of S&P 500 firms had a monthly average RSI above 70. That makes sense, since we expect stock prices to be bid up rapidly when we’re coming out of a recession.
By contrast, during long economic expansions (3 below), market RSI levels fluctuate in the 5% to 10% range, with regular spikes around 20% during quarterly earnings reports.
By contrast, market RSI levels tend to be lower than normal when investors are looking for yield in other ways. It happened during the initial public offering (IPO) boom before the dot-com bust (4), and again when Americans were flipping houses and refinancing like mad during the run-up to the 2008 financial crisis (5).
We Live in Interesting Times
The chart above shows two historically unusual conditions that started at the end of 2016.
First, each “low” in the market RSI measure is higher than the last. That suggests that the average monthly market RSI level is trending higher over an extended period (the red arrow). There’s nothing like that in previous decades.
Second, January’s spike in the monthly average market RSI level — the green line — is the highest it’s ever been outside a recovery from recession.
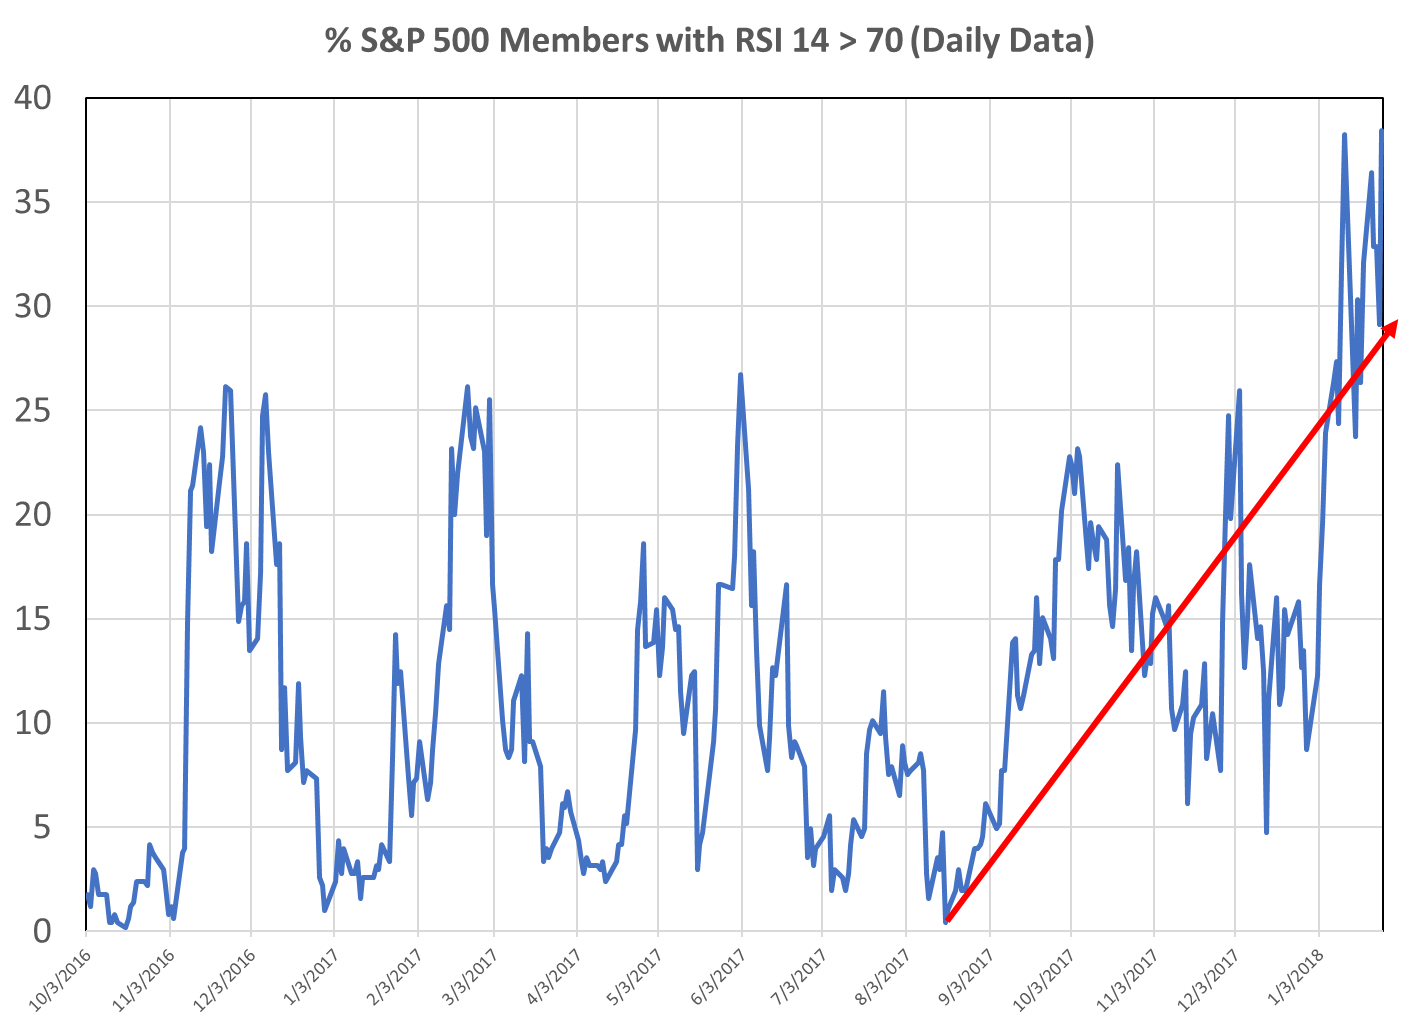
When we switch to a daily average measure of the RSI market level, we see regular oscillations between about 5% and 25% since the end of 2016.
But starting in late summer last year, we again seen a steady rise in the trend.
We also see a spike in the RSI market level — to nearly 40% — just before last week’s big pullback.
RSI: Good for Trees, Bad for the Forest
High RSI for individual stocks? Good. For too many at once? Dangerous.
Here’s my interpretation. Starting in late 2016, two things happened.
- Optimism about the Trump presidency blew away the little clouds of caution that hover around investors, even in a bull market. As this sunny outlook grew, it snowballed — sorry to mix metaphors — ushering in the “euphoria” portion of the market cycle. We seem to have hit peak euphoria in late January when average daily market RSI nearly hit 40% … just before last week’s pullback.
- The massive growth in exchange-traded funds (ETFs) over the last few years has distorted average market RSI levels by boosting the share prices of “undeserving” firms included in sectoral ETFs. The rising ETF tide lifted all boats … preventing market RSI levels from falling back down to historical norms.
Either way you look at it, folks, this isn’t normal. And if history is any guide, it’s not going to end well … unless you’re prepared.
Kind regards,

Ted Bauman
Editor, The Bauman Letter
Editor’s Note: On average, American couples in their mid-50s to mid-60s only have $104,000 saved up in their retirement account. However, few Americans know about a retirement secret so powerful that it can automatically increase your retirement account by $591,000 or more. If you have money in a traditional IRA or 401(k), click here to learn about a much better way to grow your wealth.