
In May, I showed you a unique chart pattern forming in the financial sector — a head-and-shoulders pattern, to be specific.
That pattern has broken down, but the sector itself — which I track with the Financial Select Sector SPDR Fund (NYSE Arca: XLF) — is now range-bound, and that can be just as important to realize as a head-and-shoulders pattern.
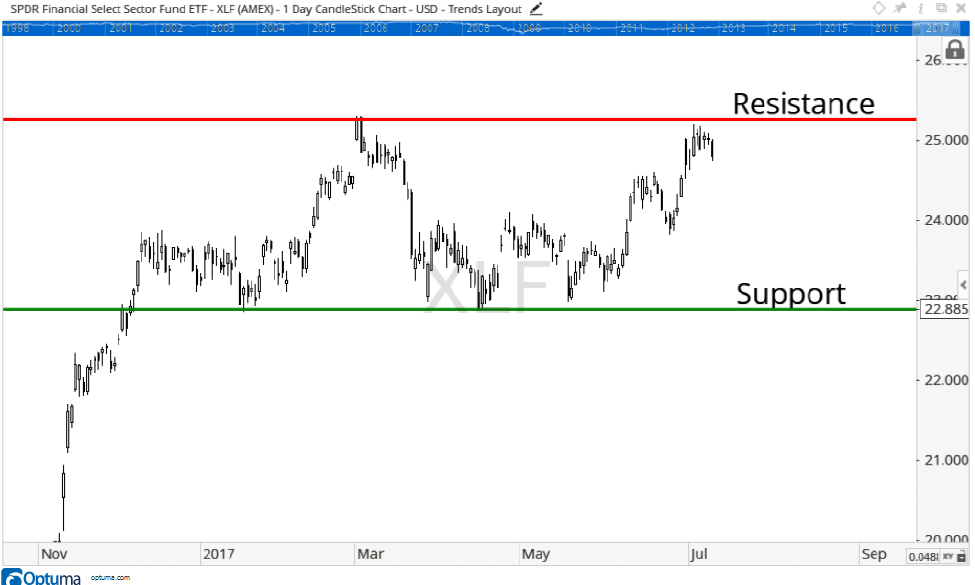
The previous neckline of the head-and-shoulders pattern is now a simple support level around $23. And the top of the head on the head-and-shoulders pattern now marks resistance.
Take a look:
A range-bound pattern is not as ominous as a head-and-shoulders pattern, which typically implies a reversal of the trend.
With a range-bound pattern, it’s hard to predict which direction it will break out in. But the breakout is what you wait for. A decisive break, either below the support level or above the resistance level, tells us what direction prices are likely to continue trending toward.
So right now, be patient with the financial sector.
The rally in June may not hold, and a decline, while it may seem imminent, doesn’t have to play out. As you can see from late March to early June, prices stayed in the bottom half of the range. The same could be true for the coming months.
That’s why we stay patient and wait for the breakout to tell us which direction to place our bets.
Regards,

Chad Shoop, CMT
Editor, Automatic Profits Alert