
With the technology at our fingertips, it’s easy to overlook some classic things.
For example, I usually spend two to three hours a day running computer programs to help me analyze charts and depict patterns. But it’s some of the classic chart patterns that are the hardest to code into a computer — most need to be seen by the human eye.
They are still easily tradeable patterns and have easily determined signals, and one recently appeared for the financial sector exchange-traded fund: the Financial Select Sector SPDR Fund (NYSE Arca: XLF).
The pattern I stumbled on is a classic head-and-shoulders pattern. This is typically a reversal pattern, meaning once it is formed, prices usually head in the opposite direction. In this case, it is calling for a sharp decline — and soon.
Take a look:
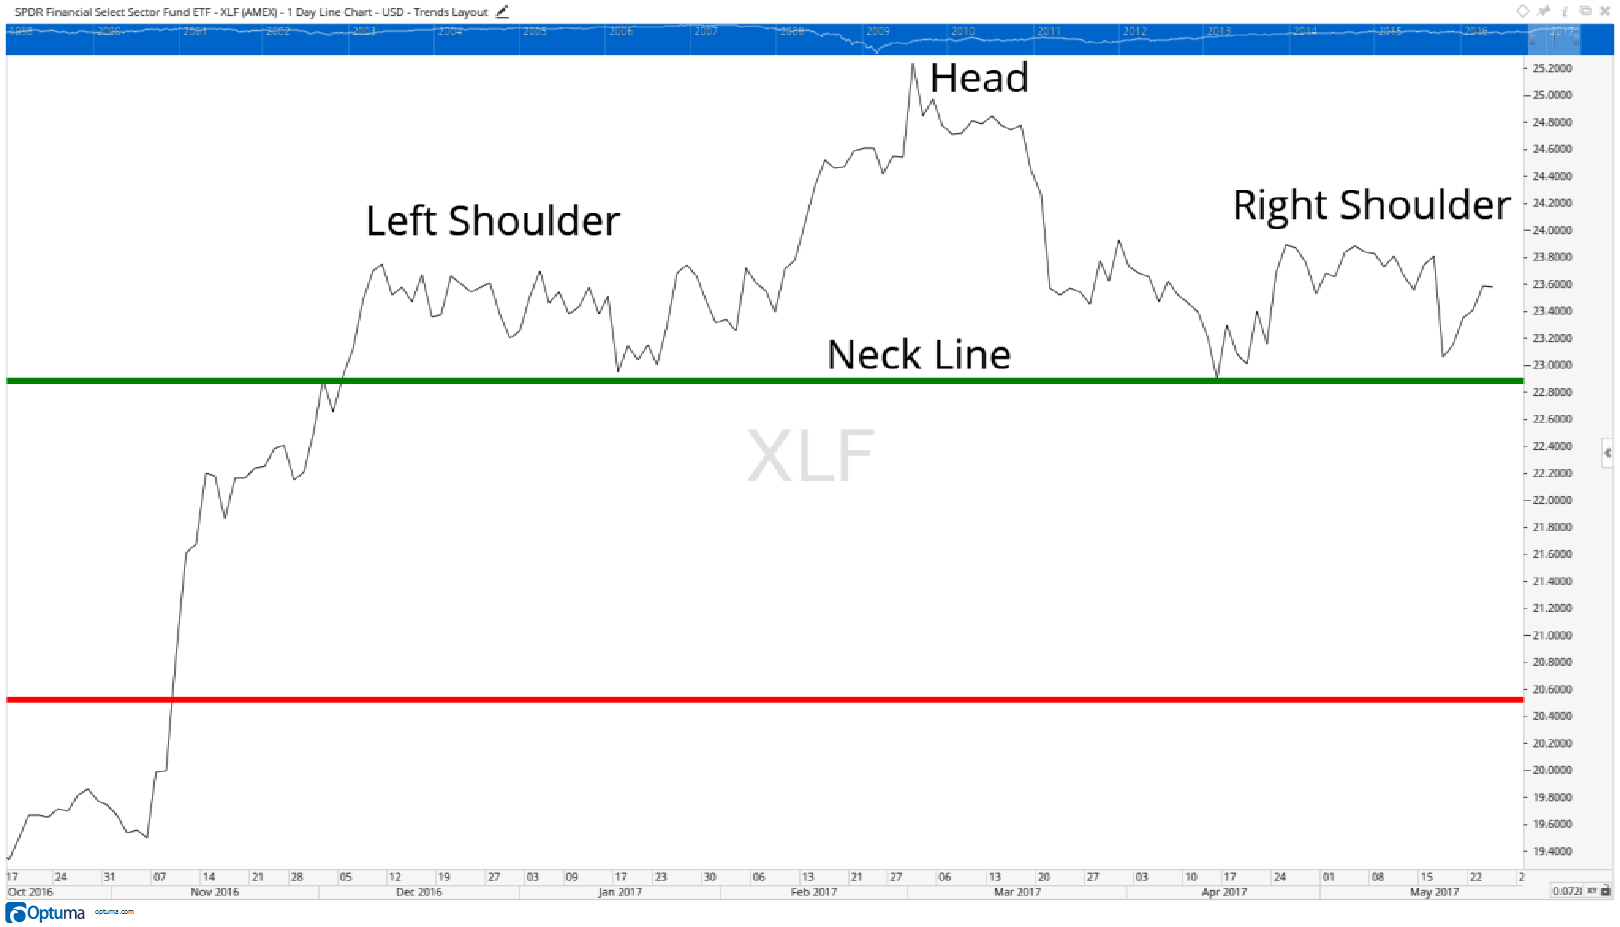
I labeled the key parts for you — left shoulder, head and right shoulder. But the most important is the neck line (the green line) — this acts as support for the pattern. When shares fall below that, that’s how we know the pattern is completed and we can look at our price target.
Our price target on the chart is the red line. We determine that based on the distance from the neck line to the top of the head, then we subtract that amount from the neck line.
Nothing works out picture-perfect all the time, but the setup so far is about as textbook as it comes. If shares break below the neck line soon, we are looking at a rapid sell-off as stocks falls toward the price target.
Regards,

Chad Shoop, CMT
Editor, Automatic Profits Alert