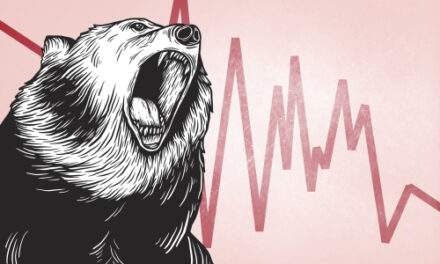
Many younger traders don’t know what a bear market is.Some of you will want to argue with me, pointing to 2020. And yes, technically that was a bear.The S&P 500 fell 35% between February 19 and March 23. This is a bit less than 41%, the average decline of a bear market since 1920. And it meets the classic definition of a bear market being 20% down from the highs.But more importantly, the 2020 “bear market” only lasted a month — far below the average length of 18 months. And just six up days interrupted this 23-trading-day bear.Real bear markets aren’t that clean. They’re characterized by periods of relief… and then deeper despair.Younger traders aren’t prepared for this. They’re likely to buy too early on the next sign of hope and succumb to that deeper despair.I don’t want you to fall for it. Especially when there’s a much easier way to make money in bear markets than trying to time the bottom.And there’s no better example than the bear market most young investors weren’t around for….
What the Next Bear Will Be Like
Let’s revisit the last true bear market, from 2007 to 2009.Over the course of 352 trading days, the S&P 500 fell 56%.But it wasn’t a straight move down…See, a real bear market is characterized by “bear market rallies.” These are sharp up moves, where major market averages gain at least 10%.If you’ve never experienced this, you can probably imagine how it feels. There’s a sense of relief and hope that the bear is over…Until the rally ends, and despair deepens.The 2008-2009 bear was full of these moments.The chart below shows eight different 10% rallies that took place between 2008 and 2009:

(Click here to view larger image.)
The blue line at the bottom is drawn in hindsight. It changes direction whenever the price moves by at least 10%.For example, the segment marked “1” shows a 15.1% gain over four months. This came after the SPDR S&P 500 ETF (SPY) had fallen 19.6% in three months.This was a bear market rally. It ended in May 2008.As the decline resumed, many traders decided to buy the dip. They believed the worst of the crisis was behind them.After all, the Federal Reserve had just initiated unprecedented quantitative easing programs in March. And from a few successful open market operations, it appeared that the Fed could stop the decline.But looking back, we know the bear market was just getting started. SPY dropped another 48% after that bear market rally. And there would be seven more 10% rallies before the bear ended. Each was followed by a wave of optimism and eventual disappointment.This is what the next bear will be like.The 2020 bear ended when governments around the world flooded the economy with cash. They won’t be able to do that again anytime soon. So, the decline will take time to play out.We need to be cautious until we have signs of a long-lasting bottom. I’ll be watching for them, but I don’t expect a new bull to begin this year.So if you’ve been scooping up stocks at these discounted levels, you might want to slow down and keep some cash on hand.At the same time, try to recognize a bear market for what it is — a slow bleedout with spikes of excitement that can be easily taken advantage of with options.Bear market rallies provide incredible trading opportunities. And, as Jim Cramer likes to scream, “there’s always a bull market somewhere.”We will watch for these trades and selectively profit while others panic.
Regards, Michael Carr, CMT, CFTeEditor, True Options Masters
P.S. Lately I’ve been talking a lot about my newest trading indicator, the Greed Gauge.Despite its name, you should know that the Greed Gauge isn’t a simple trading system for up-only markets.Not even close.In fact, what it’s best at is detecting the beginnings of a bear market rally… and getting you out before relief quickly turns back into despair.We’re mere days away from unshackling my Greed Gauge and releasing it to the world.
And next week, you’ll see how invaluable it will be to trading this bear market well. Stay tuned.
Chart of the Day:The AAPL Doesn’t Fall Far
By Mike Merson, Managing Editor, True Options Masters

(Click here to view larger image.)
I’ve often made the point that Apple Inc. (AAPL) makes up a gratuitous portion of the S&P 500. Nearly 7%.So, whether you’re an iPhone diehard or one of those dirty, despised, green-text-message-having Android poors (if you are, you’re in good company), it’s important to watch AAPL to know the state of the market.And in my opinion, AAPL is set to stabilize here along with the market.Take a look at the daily chart of AAPL above. It looks like it’s entering a key zone of support — the early 2021 high and the mid-Fall lows.Granted, AAPL just smashed through it’s 200-day moving average. It hasn’t done this since late 2018. (Yes — even during the pandemic panic, AAPL quickly bounced off this line.) The other averages are also in a bearish stack.Still, AAPL’s recent earnings and leaked announcements of an augmented reality device make me wary of getting bearish on the stock here.I don’t see AAPL going any lower than $125 anytime soon. I would actually add to my stock position there.If you’re looking for a more conservative signal, wait until AAPL crosses back above the shorter-term averages before buying in.
Regards,
 Mike MersonManaging Editor, True Options Masters