
Analysts are wrong about earnings most of the time. Earnings forecasts are too high or too low about 90% of the time.
At the end of last week, 57% of the companies that make up the S&P 500 Index had reported earnings. So far, it’s shaping up as a typical quarter. Nearly three-quarters of the earnings reports (73%) were better than expected, and 17% were below expectations. The data on accuracy for earnings and sales forecasts is summarized in the chart below.
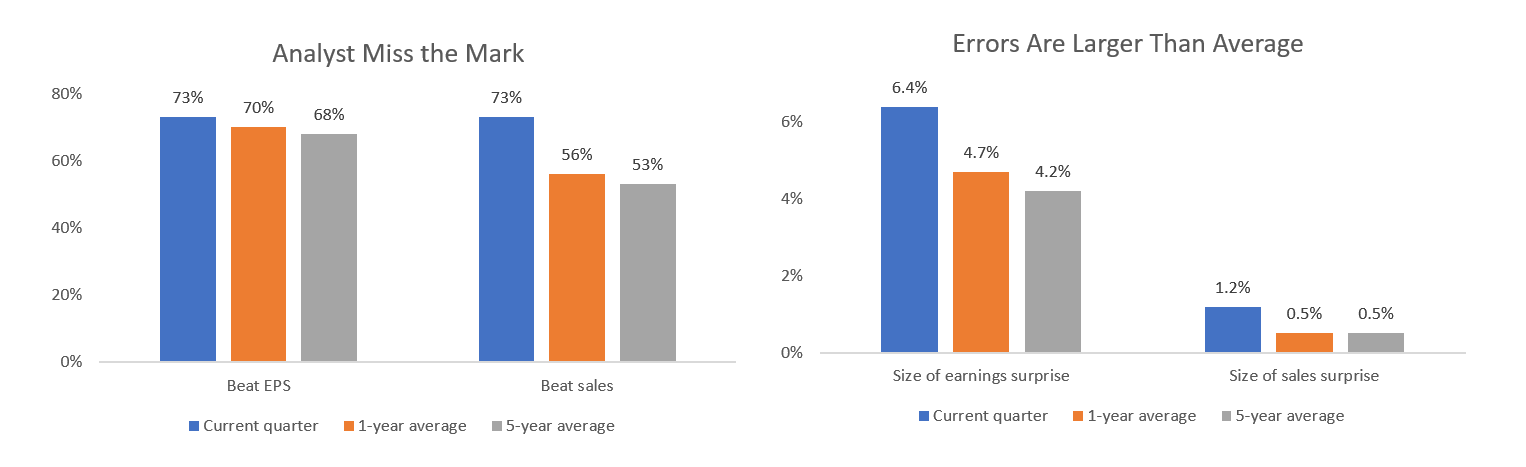 As the chart on the left shows, the percentage of companies beating estimates for earnings per share (EPS) is close to average. But the percentage beating expectations for sales (73%) is well above average.
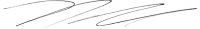
The chart on the right compares the size of the surprise in earnings and sales to the average. Once again, analysts are well off the mark.
Analysts generate estimates by extending current trends into the future and then talking to management to either raise or lower the initial estimate. The size of the earnings and sales surprises indicates something didn’t work well last quarter.
Analysts and management seemed to underestimate the demand of their customers. This explains the stronger than expected sales. The demand seems to be from customers since business inventory levels did not show a big gain in the quarter.
This could all be bullish for the stock market.
Right now, analyst estimates show the stock market is overvalued. Using current earnings forecasts, the price-to-earnings (P/E) ratio for the S&P 500 is 17.7. Some investors are worried because this P/E ratio is above the five-year average of 15.4, and above the 10-year average of 14.0.
But if estimates for earnings are low, the stock market may not be overvalued. This is good news for the bulls because it means higher stock market prices are likely.
Regards,
Michael Carr, CMT
Editor, Peak Velocity Trader