
In today’s Roaring ‘20s video, I discuss:
- Why investors who worry too much about crashes can miss out on large gains.
- Some easy-to-spot sell signals that come right before crashes.
- How you can use popular trading tools to stay on the right side of major market trends.
To watch my new video, click the play button below…
It’s a cliché, but the Roaring ’20s offered investors the best of times and the worst of times.
Gains in many stocks were large in the best of times. But many investors, if not most, overstayed their welcome. They suffered large losses in the worst of times.
Those times included the deepest bear market in history.
The 1929 crash was the start of a three-year bear market. The Dow Jones Industrial Average lost 89.5% of its value. Recovery took 25 years.
Looking back, the worst of the bear market was avoidable. Many indicators offered sell signals before the crash.
Pre-Crash Sell Signals
One indicator that provided warning of the bear market is the monthly MACD, or moving average convergence/divergence.
I wrote about this indicator in April. Investors can profit from its signals, as I showed in this video.
Monthly MACD is a great indicator. But many investors don’t use it.
The truth is, many investors are too nervous to rely on monthly indicators, no matter how profitable they are. They worry that waiting until the end of a month locks in large losses.
Fortunately, they don’t have to wait four weeks for new signals. Weekly indicators can also help investors avoid market crashes.
Now, these indicators weren’t available in the 1920s. I’ve talked to market historians, and all agree analysis was simpler at that time.
Some analysts used moving averages. Others used a chart technique called “point and figure.”
Familiar momentum indicators became popular in the 1960s. But a few investors relied on momentum in the 1920s.
The first academic paper on relative strength (RS) investing appeared in the 1960s.
I talked to the author of that paper a few years ago. He said he learned the technique from a trader who used it throughout the ’20s and ’30s.
To track RS, I developed an indicator called peak velocity. It’s shown in the middle of the chart below. VIX Flip is at the bottom of the chart.
I developed my peak velocity indicator to track the emotions of investors. Both it and VIX Flip turned bearish weeks before the 1929 crash.
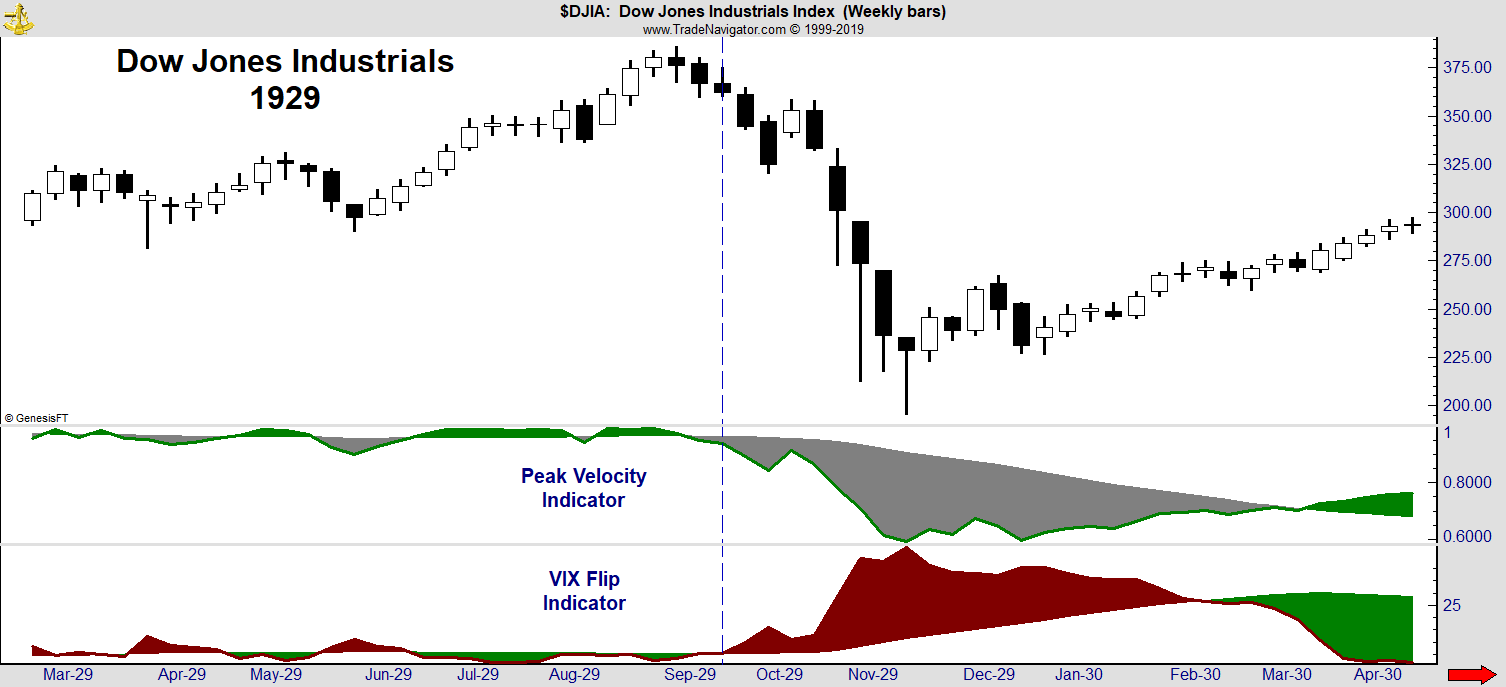
The blue line shows when both gave sell signals.
These indicators continue to work. I recently wrote about how VIX Flip warned of last year’s sell-off.
Right now, these indicators are bullish. To see a current chart and learn how to calculate these indicators, click here to watch my video.
Applying Popular Technical Indicators the Right Way
Now, I know few investors will use these indicators. They simply aren’t popular enough to be widely available.
But there’s good news. Popular indicators also warned of the 1929 crash.
Popular indicators include the Relative Strength Index, stochastics and MACD.
These indicators aren’t perfect. Most have lousy track records. But it’s possible to gain profitable insights with these indicators by using them slightly differently.
All three indicators I mentioned measure momentum. Most investors use them to find market reversals.
But these indicators rarely provide profitable signals on a consistent basis.
One way to improve the profitability of indicators is to require confirmation. In other words, only take MACD signals when stochastics agrees.
The next chart shows this strategy. MACD’s at the bottom of the chart.
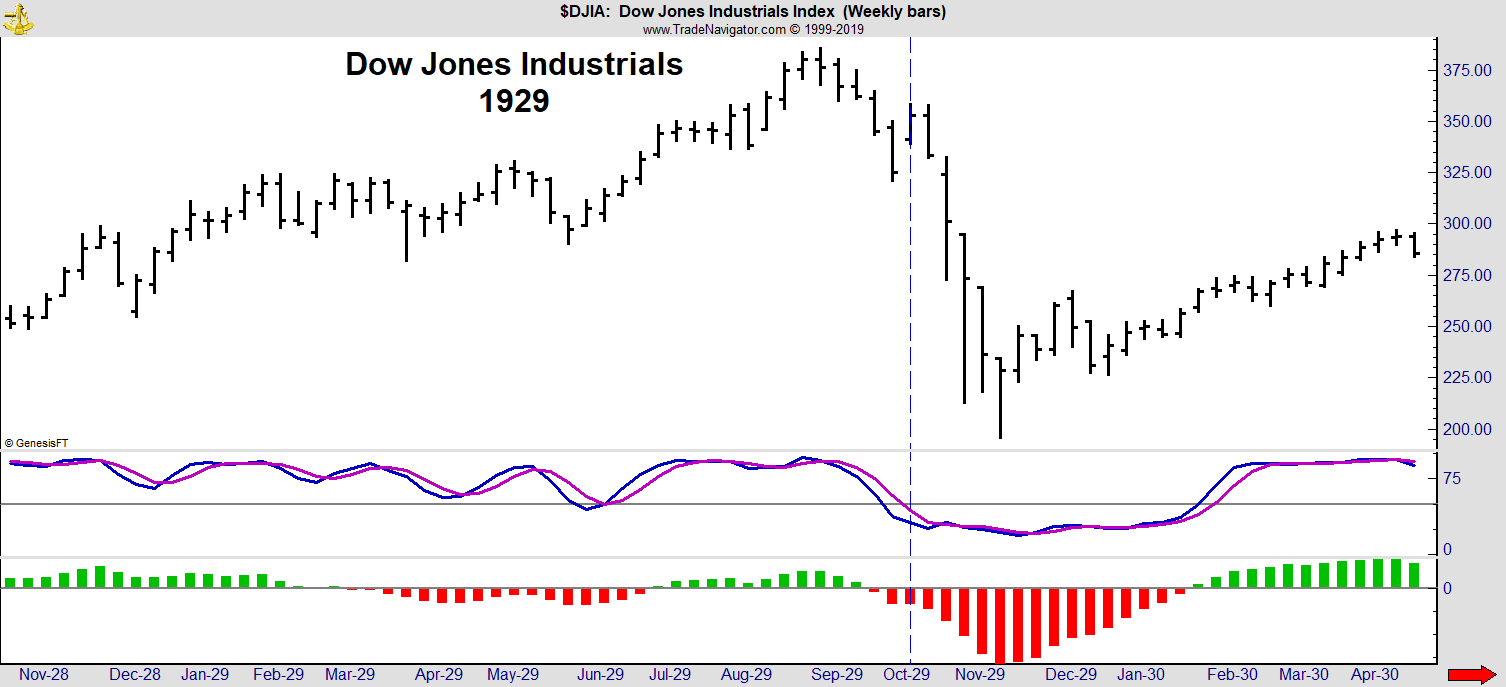
This is a simple histogram that’s available at many websites. Technically, it shows the nine-week moving average (MA) of the difference of the 12-week and 26-week MAs of price.
For stochastics, most investors look for sell signals when the indicator is above 80. Buy signals develop below 20. That doesn’t work well because extreme readings in the indicator show strong trends.
In the chart above, stochastics is in the middle. The solid gray line at 50 defines buy and sell signals.
When MACD is on a sell signal, only sell when both lines of the stochastics indicator fall below 50.
In a similar way, ignore MACD buy signals until stochastics rises above 50.
In 1929, this simple strategy gave a sell signal two weeks before the crash.
This strategy also avoided market crashes in 1987, 1997 and 2008. Those are the most important crashes since 1929. There were also many more successful sell signals with this strategy.
A Complete Strategy for the Next Decade
An important part of this strategy is that it also provides signals to get back into the market. That avoids the biggest problem investors face in bear markets.
Investors often worry the decline will resume. They wait for lower prices to buy back in.
Strong bull markets never give them that chance. They miss out on gains. In the long run, that leaves them worse off than a simple buy-and-hold strategy.
Now you have a complete strategy for the next decade.
That strategy participates in bull markets. It also signals the end of the bull market. This is important for the market we’ll see in the next few years.
Invest With Confidence
Federal Reserve officials insist that interest rates will stay low. That means stock market valuations should remain high.
As a technical aside, that’s because analysts use interest rates in discount cash-flow models. Low rates lead to high valuations.
High valuations make investors nervous. They can’t help it.
Investors prefer bargains to richly valued stock markets. That’s true even when low interest rates justify high valuations.
Until interest rates return to normal, investors will remain nervous. Nervousness will create crashes.
Fortunately, you don’t have to be nervous.
You can closely follow monthly momentum indicators. This simple strategy will warn you before future crashes, just like it signaled crashes over the past 100 years.
Now you know you can protect your wealth. So, you can invest with confidence in the profitable decade that lies ahead.
Kind regards,
![]()
Michael Carr, CMT, CFTe
Editor, Peak Velocity Trader