
Investor Insights:
- When breadth diverges from price, traders expect to see a reversal in the price trend.
- Breadth divergences create news. The Wall Street Journal features stories on how the end of the bull market is near.
- But you should ignore the news. Here’s why…
I read many of the military classics when I was at Air War College and other military schools.
Sun Tzu’s The Art of War was written 2,500 years ago but still guides battle plans in the age of drones. Other military scholars wrote hundreds of years ago yet still offer lessons to the modern-day military officer.
I often see copies of some of those books when I visit Wall Street analysts. The Art of War is on many bookshelves because it describes the importance of understanding your enemy.
One analyst told me she believes management teams are like enemies in battle. Sun Tzu helped her value companies.
This fascination with the military might explain warlike analogies in finance. One example is that all descriptions of market breadth are based on a military analogy.
Generals and Troops
An index like the Dow Jones Industrial Average only includes a small number of stocks. It’s possible the Dow could be rising while most stocks are falling.
Market breadth indicators measure how many stocks are part of a market trend.
To explain breadth, analysts say a general can’t win a war by himself. A leader needs their troops behind them to make long-term progress. Without followers, the general’s attack fails.
The same is true in the stock market. A general such as Boeing can lead the Dow higher.
That stock accounts for more than 8.5% of the index. Gains in Boeing could offset losses in the index’s other 29 stocks.
This problem exists in many indexes. Apple and Microsoft account for more than 22% of the Nasdaq 100 Index. These two stocks can move the entire index.
Breadth indicators overcome this problem.
Interpreting Breadth
In a healthy market, breadth and price confirm each other. New highs in an index coincide with new highs in breadth indicators.
When breadth diverges from price, traders expect to see a reversal in the price trend.
Breadth divergences create news. Analysts appear on CNBC. The Wall Street Journal features stories on how the end of the bull market is near.
But you should ignore the news. Divergences are common. They’re also likely to last for months, or even years.
A Bearish Divergence
There are many breadth indicators. At any time, they almost always tell the same story.
A recent divergence formed in 2014. It preceded a 15% decline in the S&P 500 Index, which is shown as the black line in the chart below.
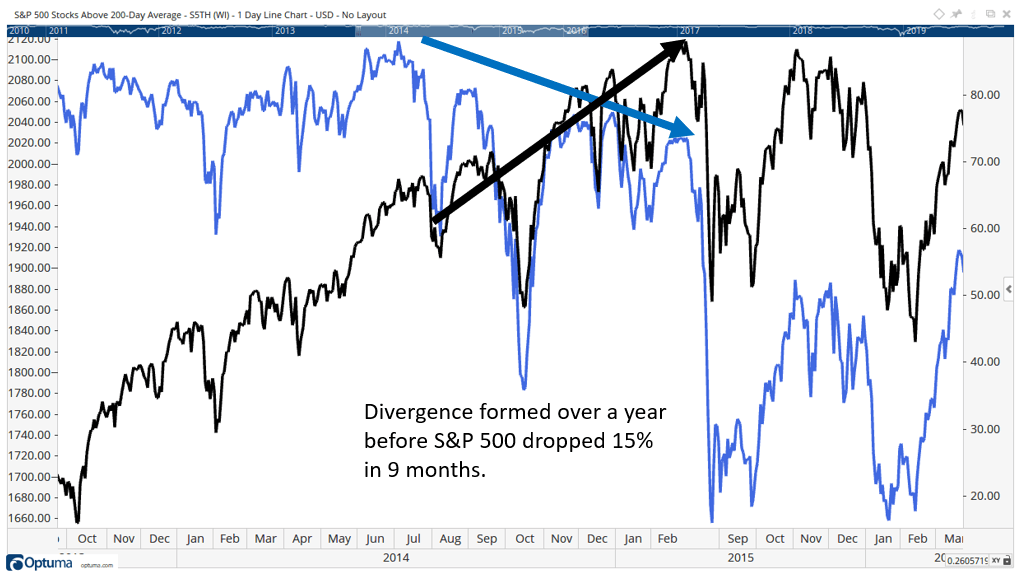
The breadth indicator in the chart is the percentage of stocks in the index that are above their 200-day moving average (MA).
There are several ways to measure the direction of the trend in stocks. The simplest is to compare the price to an MA. If the price is above the MA, the trend is up.
Analysts use a variety of MAs with this technique. The most popular is probably the 200-day MA. That MA defines the long-term trend.
When a stock is above its 200-day MA, the stock is in a long-term uptrend. When most stocks are in uptrends, the stock market is bullish.
In the chart above, breadth fell as prices rose. This was a bearish divergence. Eventually, price followed breadth lower.
Trade Breadth Indicators Instead of Headlines
To develop a trading strategy from this indicator, I defined precise rules that focused on reducing risk.
To do that, I set the buy level at 65% and the sell level at 60%.
That means I buy when the percentage of stocks in uptrends is 65% or higher, and I sell when the percentage is 60% or lower.
There aren’t a lot of trades with this strategy. There have been an average of about two a year.
In the past 10 years, this strategy gave 24 buy signals, and 15 of them (63%) were winners. More importantly, sell signals preceded all significant declines.
The largest loss with this simple strategy in the last 10 years was just 3.6%.
We’re Still in a Bull Market
Right now, more than 70% of the stocks in the S&P 500 are above their 200-day MA. The indicator is on a bearish divergence, with lower highs warning some analysts the end of the bull market is near.
Eventually, prices will turn down. But breadth indicators are almost always early. For example, the divergence before the bear market that began in 2000 developed in 1998, two years early.
Most likely, there will be a bear market within two years.
Breadth divergences will grow before then. Wait for breadth to break down, with the percentage of stocks in the S&P 500 trading above their 200-day MA falling below 60%. That’s when risk will be high.
Until then, we’re in a bull market. And I say it’s still time to buy.
Regards,

Editor, Peak Velocity Trader
P.S. If you haven’t watched my new video on options trading yet, I suggest you check it out: