

One week into summer break, and I’m still adjusting to having my three kids back in the house all day during my office hours.
It’s been a bit chaotic with noise and distractions everywhere … kind of like trying to make sense of the stock market while being bombarded with headlines around inflation, interest rates and a global supply chain crisis.
So, it might seem odd that I’ve recently talked about catalysts impacting stocks in phases or following a neat pattern like a row of toppling dominoes. That almost implies that some orderly course of events can make the next market move predictable.
But as I’ve demonstrated throughout 2022, it’s possible to spot the next big move when you combine experience with a disciplined and objective approach.
That’s why I want to show you the next shoe to drop for stocks.
The (Not So) Big Secret Behind Stock Prices
The value of any stock, or stock market index like the S&P 500, can be boiled down into two simple components:
- How much the company earns each quarter.
- How much investors will pay for earnings.
The latter is captured by valuation metrics like the price-to-earnings (P/E) ratio. Several of these metrics were at all-time highs going into 2022, meaning the average investor was paying a high price for the average company’s earnings. Then interest rate hikes started playing “tug of war” with projections, and investors decided they wanted to pay less.
The technical term for it is multiple contraction and you can see it in the chart below from JPMorgan. Shrinking valuation multiples (blue line) have lopped nearly 20% off the S&P 500 so far this year:
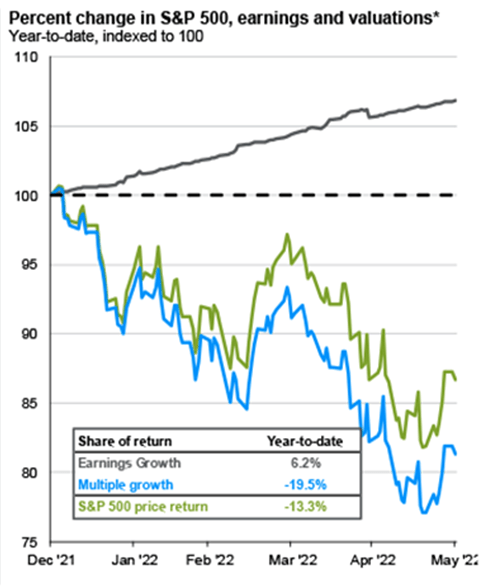
Source: J.P. Morgan Asset Management
There’s another line that should stand out, and that’s the gray line. That’s how much earnings growth has contributed to the S&P 500 return year to date, which currently stands at 6%.
That is the next shoe I expect will drop — as steady earnings growth turns into decline.
We’ve already seen warning after warning. A couple of weeks ago, Snapchat’s stock plunged 30% after warning that second-quarter results would be worse than initially expected. Then yesterday, Target (NYSE: TGT) came out and cut profit margin guidance from its projections released only a couple of weeks ago.
That means the next leg down for this bear market will be driven by negative earnings revisions.
Finding the Right Side of the Trade (at Least 88% of the Time)
Valuation metrics like P/E ratios are important tools. But quantitative analysis takes things a step further — evaluating not just the investment itself, but also tracking the buying behavior of key market players to help you stay on the right side of earnings forecasts, and on the right side of the trade.
The quant model at the heart of my Flashpoint Fortunes options trading system has helped me deliver an 88% win rate across every trade opened and closed throughout 2022 so far — even as markets sank to the edge of bear market territory. And the analyst revisions factor is a crucial pillar for this model, helping me pinpoint the exact stocks that are earning Wall Street’s respect … along with those rapidly losing it.
So be ready for the earnings revisions to start streaming in.
And keep an eye on your inbox next Monday for a special, unedited episode of Your Money Matters, where I’ll be revealing a few more key factors to Ted — and showing you how Wall Street’s $2 trillion paper trail can point the way to your trading fortune.
Best regards,

Clint Lee
Research Analyst, The Bauman Letter