Ray Dalio is a great investor.
According to CNBC, his Bridgewater Associates provided the largest cumulative net profit for a hedge fund firm ever. He has made at least $49.7 billion for his investors.
His opinion is worth listening to. Right now, he believes we face tough times.
Dalio is a market historian and an economist. He says the debt cycle explains financial market performance. This cycle follows a pattern:
- There’s healthy debt growth.
- This goes too far, and we see a bubble.
- The bubble bursts.
- An economic contraction, or recession, follows.
- Sometimes the contraction ends, and we return to healthy growth.
- Other times, to restore growth, central banks push interest rates to zero.
As Dalio explains: “Because you hit zero interest rates, monetary policy can’t be the same. And they inevitably print money to buy financial assets, pushing those financial assets up in value. And that is what we’ve been through.”
History shows this sixth stage rarely happens. The first time was from 1929 to 1933. The second time was in 2008.
Both times, central banks propped up the economy a little. They also supercharged financial assets.
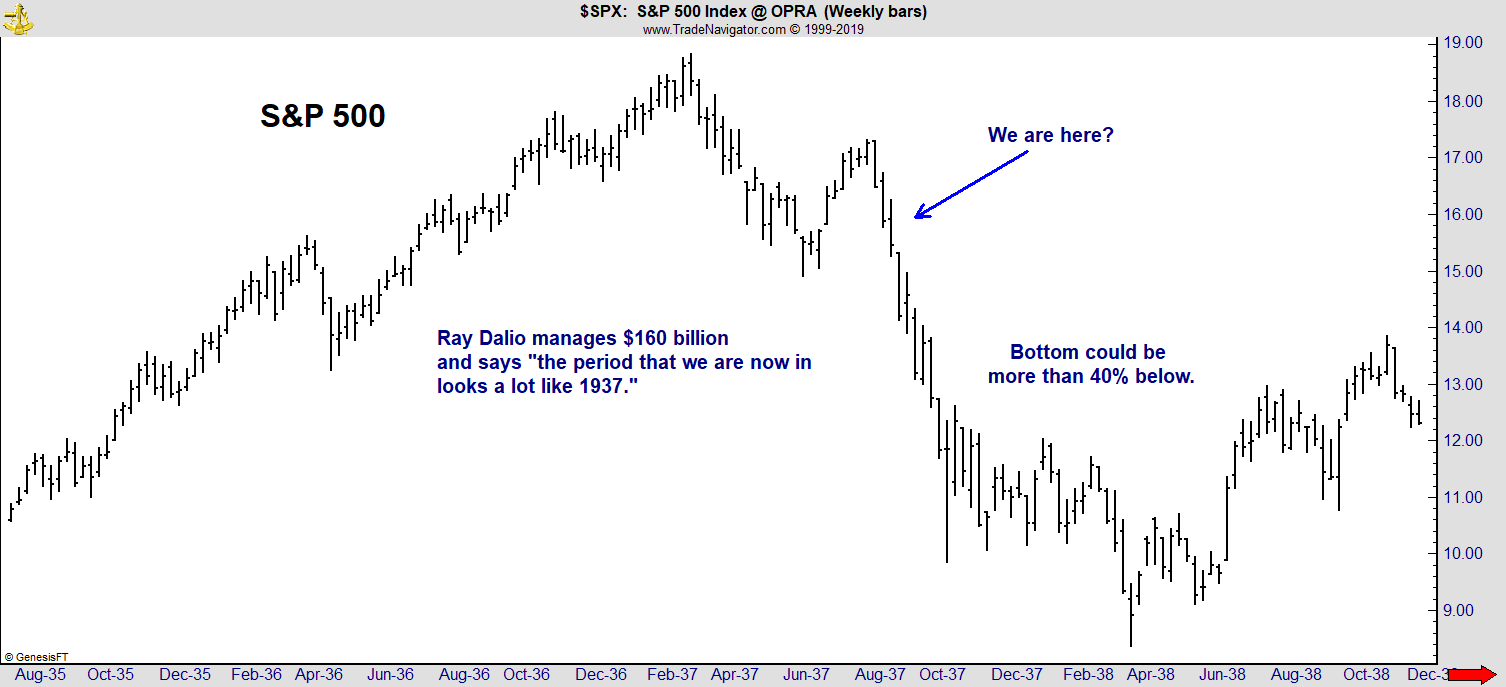
Dalio says: “The period that we are now in looks a lot like 1937.”
This is not good news for investors.
The Beginning of a Bear Market
The chart below shows stocks’ rapid decline in 1937.

Debt cycles are tied to politics. When times are tough, populists take charge.
We saw that in the U.S. with President Donald Trump’s election. Brexit is an example of populism, as is Italy and several other countries.
These periods are prone to international conflicts, including trade wars.
But there’s even more bad news. Dalio notes that:
Over the last 500 years, there were 16 times when an emerging power developed to become comparable to an existing power. And in 12 of those times there were shooting wars, which determines which country is dominant and which one has to be submissive.
He compares China’s current position of challenging the U.S. to the way Germany and Japan rose to challenge the weakening British Empire and other countries that won World War I. That’s another parallel to 1937.
The chart above shows a bear market began in 1937. The S&P 500 Index fell 56% in 13 months.
Bear Markets Take Time to Unfold
No matter what analysis I use, I keep finding the minimum target for the current market is a 40% decline. This is a bear market.
Bull traps are part of a bear market. A bull trap develops when prices rise sharply.
Investors believe the worst is over. They turn bullish and buy. Then prices fall to new lows, trapping the bulls with losses.
Bull traps look like the day after Christmas, when the Dow Jones Industrial Average rose more than 1,000 points. It was the biggest one-day gain in history. Analysts proclaimed the end of the bear market.
Just a week later, the Dow lost 660 points in one day, the eighth-biggest one-day decline in history.
Then another big up day followed a better-than-expected employment report.
Increased volatility like that is bearish. Bear markets take time to unfold.
The bear market that began in 1937 didn’t end until 1942, when the U.S. went on the offensive in World War II. The world that investors knew at the beginning of the decline had changed forever.
This bear market won’t end until we know how the trade war ends. And we are at least months away from knowing that.
Regards,

Michael Carr, CMT, CFTe
Editor, Peak Velocity Trader


