There’s always someone in an office who “didn’t get the memo.”
This is usually the person who caused the policy change. Maybe the guy who took Casual Friday too far.
There’s also someone in the stock market who didn’t get the memo. Right now, it looks like individual investors don’t understand the bull market ended.
We know that because they bought the recent dips.
The Most Volatile Index
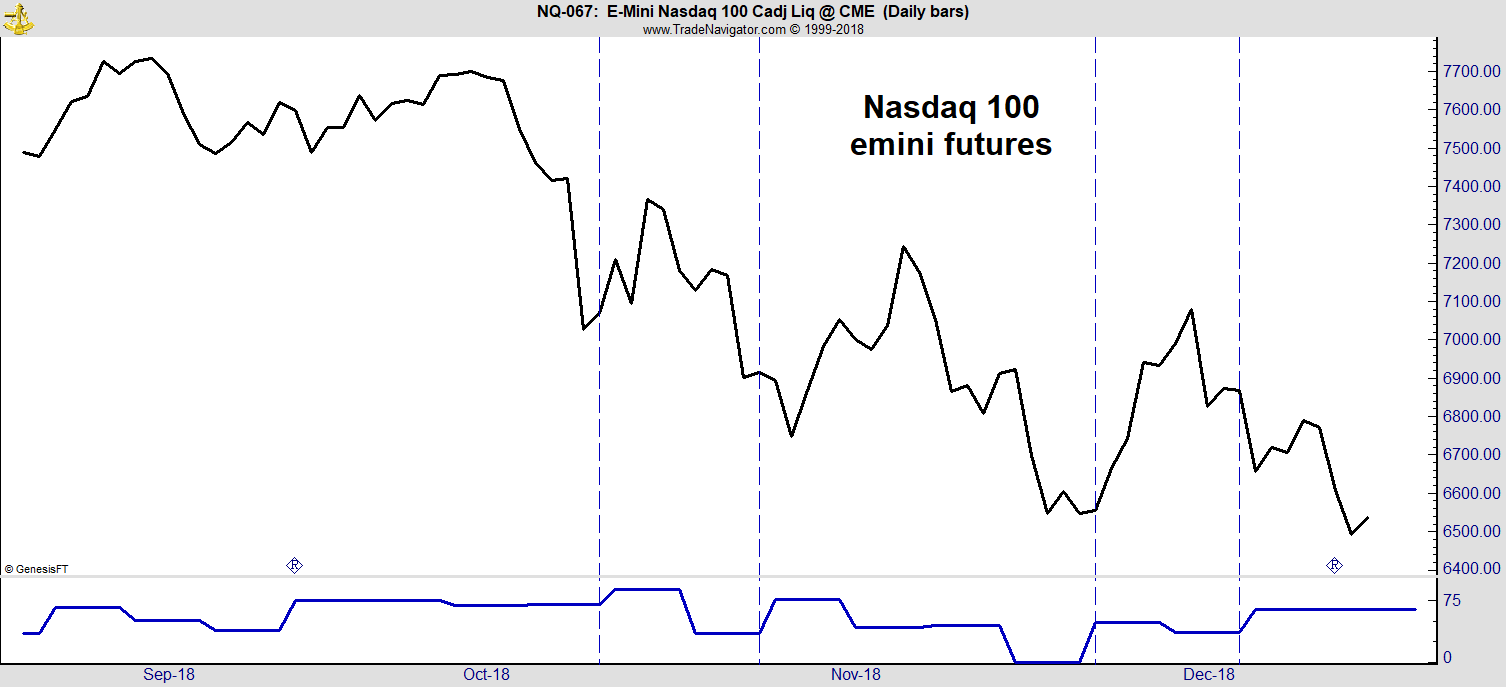
The chart below shows a popular stock index futures contract.
At the bottom is an indicator showing how bullish individual investors are. Dashed lines show individuals are buying more when prices drop.
 This is a chart of Nasdaq 100 futures. It’s often the most volatile index.
The Nasdaq 100 assigns large weights to Apple, Facebook and other tech stocks. It can move much more than the S&P 500 Index and is low-priced. That makes it attractive to individual investors.
Futures contracts use leverage. Leverage involves borrowing money to increase potential returns.
With the Nasdaq futures, a trader can buy $130,000 worth of stock for about $7,700. That means futures are risky.
With that $130,000 purchase, a 1% move in the market results in a loss of $1,300. That’s about 17% of the amount of money invested in the contract. So futures traders tend to cut losses quickly.
Buying the Dips
Like stock markets, government agencies set the rules of the game. To keep markets fair, large traders must report what they buy and sell every week.
Analysts call one group of large traders the “smart money.” This group is right about major trends more often than not.
The weekly report of traders’ positions also shows what individual traders are doing. This group is often wrong.
The indicator at the bottom of the chart uses this data from the Commitment of Traders report. It’s published by the Commodity Futures Trading Commission every week.
The indicator converts the number of contracts individuals own into an index. The index shows how bullish investors are relative to the past two years. Jumps in the index show an increase in bullishness.
While the chart shows the Nasdaq 100, we see a similar pattern in the S&P 500 and other indexes. Individual investors are buying the dips.
Bulls in a Bear Market
Bull markets condition individuals to buy dips. Uptrends reward buyers for that behavior. But in a bear market, dip buyers rapidly face large losses.
The problem for traders is knowing when the bull market ends.
Several indicators show the bear market began in October. Momentum and trend-following indicators turned bearish in the past few weeks. Price patterns also confirm a downtrend is underway.
But individual investors fueled the bull market in the Nasdaq 100 stocks. Now, they refuse to recognize the direction of the trend changed.
They really are acting like that guy who wore shorts that were too short on Casual Friday, and then pretended he didn’t see the memo requiring suits and ties every day.
Regards,

Michael Carr, CMT, CFTe
Editor, Peak Velocity Trader


