Market breadth indicators tell us how many stocks are part of the trend.
Each stock gets one vote. So, the smallest stock in the Russell 2000, $80 million Unique Fabricating Inc. (NYSE: UFAB), affects breadth as much as the largest stock in the S&P 500, $870 billion Apple Inc. (Nasdaq: AAPL).
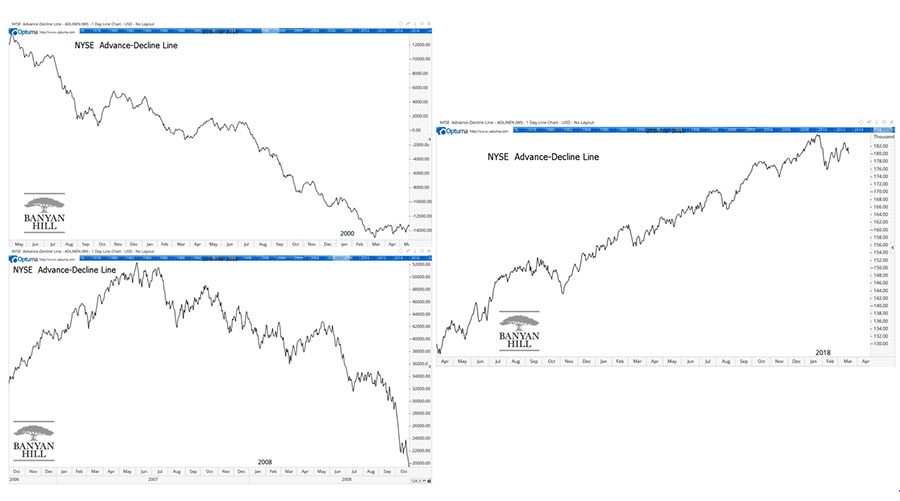
Breadth usually turns down before a bear market. The chart below shows breadth before the 2000 and 2008 bear markets and now.

As you can see, there’s no sign of weakness in breadth for now. That means stock market averages should reach new highs soon.
Advance-decline Line
To calculate the advance-decline line, we count the number of stocks that move up and down each day. Subtract declining issues from advances and plot the value on a chart every day.
Over time, the line develops a clear trend. And breadth is an uptrend right now.
At market tops, breadth leads price. In other words, the indicators turn down before the market averages are in downtrends. That’s why it’s important to follow breadth indicators.
Breadth breaks down first because at the end of a bull market, just a few stocks are moving up. Most stocks already turned down months earlier.
This happens because smart investors are selling as indexes peak. They’re selling to individual investors with a fear of missing out.
Individual investors often buy names they know. Apple rather than Unique Fabricating. This leads to a decline in breadth even as the indexes rally.
For now, breadth remains in an uptrend. If that trend reverses, it means the bull market is running out of time.
Unfortunately, this isn’t a precise timing tool. Breadth breaks down much earlier than the indexes.
Breadth topped in 1998, almost two years before the bear market began. In 2007, breadth was a year early. Selling too soon means missing out on large gains as the market tops.
With breadth still rising, the bull market should continue for at least a year or more.
Regards,

Michael Carr, CMT
Editor, Peak Velocity Trader


