Stock prices show traders’ emotions.
Optimism pushes prices up. Higher prices lead to greed. Then, greed gives way to pessimism and fear.
Fear and greed drive most short-term moves in the stock market. That’s true for both individual stocks and major market averages.
One indicator designed to track emotions is the CBOE Volatility Index (VIX).
It’s based on prices of options tracking futures contracts for the S&P 500 Index. VIX has a complex formula that’s designed to move higher when fear rises.
VIX tracks changes in emotions. High readings show fear. Low readings show greed is the dominant emotion in the market.
But VIX only tracks emotions of traders in the S&P 500. There are hundreds of other indexes and thousands of individual stocks.
Most move in line with the S&P 500. But some show fear or greed earlier or later than the S&P 500.
The VIX Flip
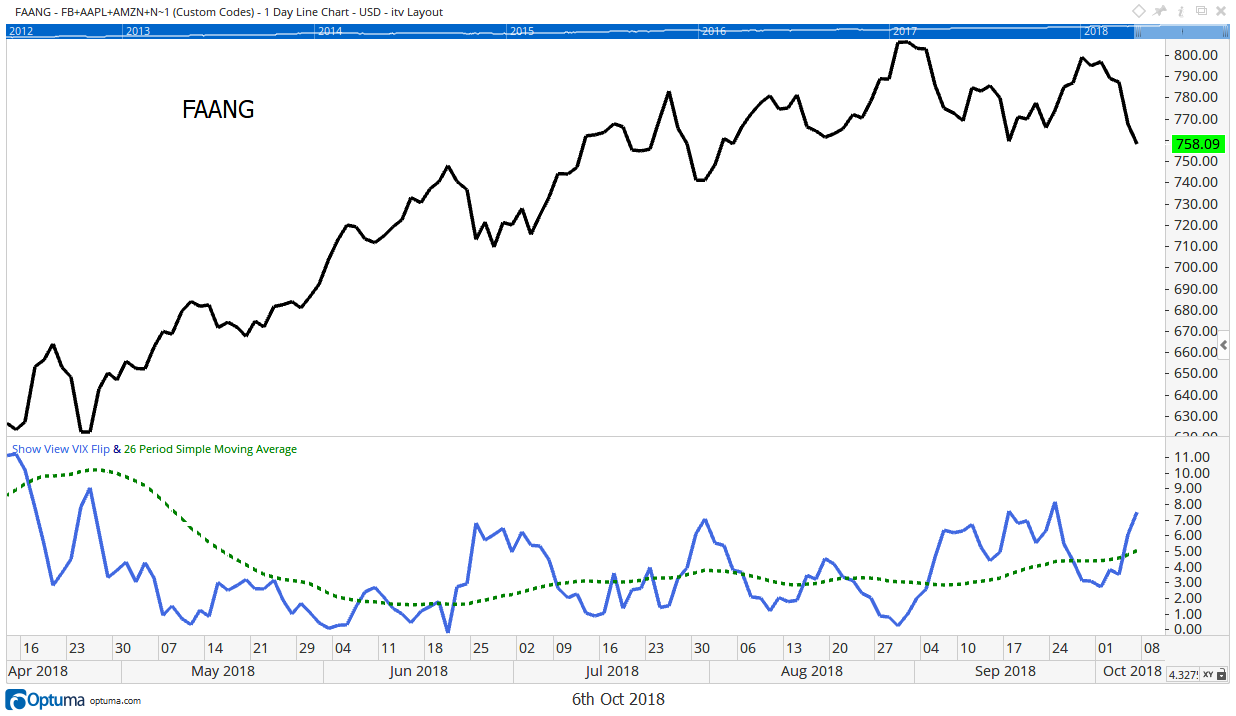
The chart below shows an indicator that’s like VIX.
It’s the VIX Flip indicator, and it works for any stock or index.
This indicator measures the emotion of traders and shows whether fear is rising or falling.

In the chart, the dashed line is a moving average of the indicator.
The moving average smooths out day-to-day swings in the indicator. It shows the trend. It also lets us see when the trend changes.
By adding a moving average to the indicator, we can spot when emotions change. When the indicator moves above its moving average, fear is rising. That’s time to sell.
If fear is falling, the indicator drops under the moving average. That’s a buy signal.
The Prospects of the FAANGs
The chart shows fear is rising in an index of the FAANG stocks.
This is important. FAANG stocks are Facebook, Apple, Amazon, Netflix and Alphabet, the parent company of Google. These five stocks make up 12.7% of the S&P 500.
If FAANG stocks are in a downtrend, it’s almost impossible for the S&P 500 to be in an uptrend. The VIX Flip tells us to expect FAANG stocks to weigh on the index in the short run.
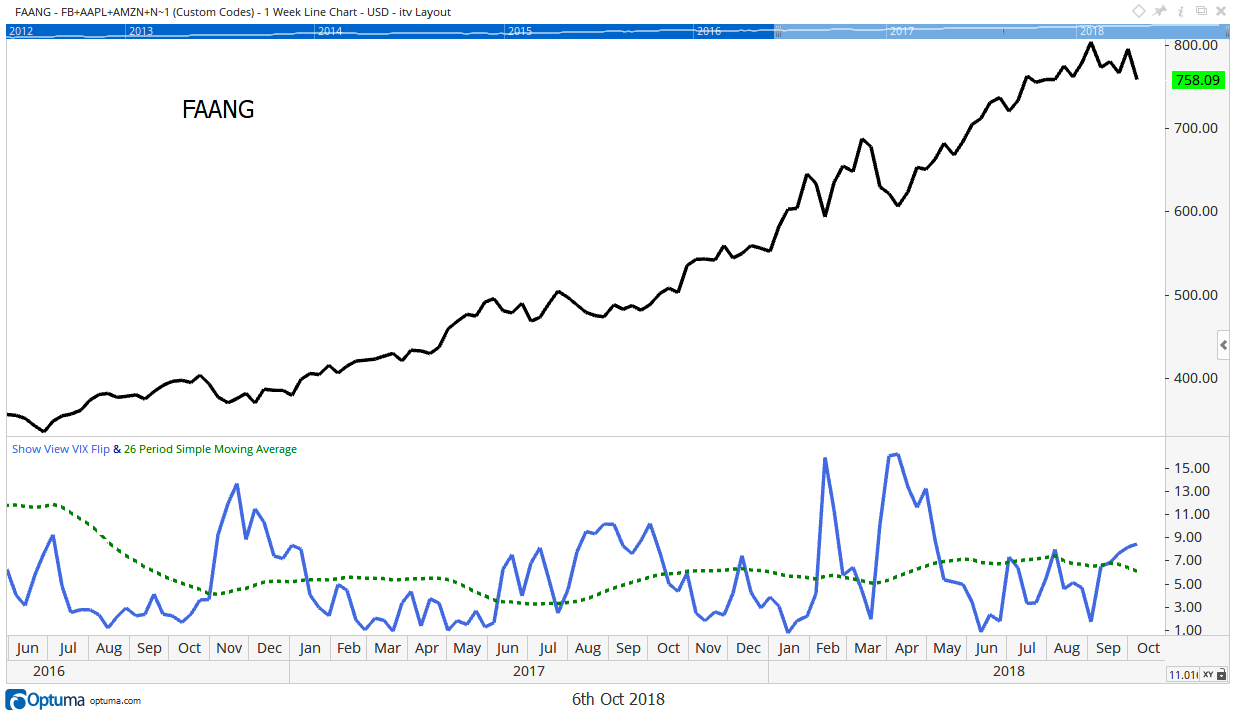
This is a volatile indicator. It gives short-term signals on the daily chart. Weekly charts provide longer-term signals.
Here, the message is similar. The next chart uses weekly data. It’s interpreted the same way.

Moves above the moving average are a sell signal. Traders are worried about the prospects of the FAANGs.
FAANG Stocks Are in Trouble
FAANG stocks have led the market higher for the past few years.
These companies created new markets in social media and online services. They created new markets. Recognizing that, traders pushed the price of the stocks up.
Now the companies face new regulations. Consumers are worried about privacy, and that could affect profits.
Business models of the market leaders face new challenges. Traders understand that and are increasingly worried about those challenges.
It makes sense to worry about the FAANGs as companies and stocks. This could mean the end of the bull market is near.
For now, it means investors should consider avoiding the stocks that lead the bull market. They are the ones that will fall the most in the next bear market.
In the past two years, sell signals in the FAANG stocks were short-lived. But in a bear market, sell signals last for months at a time.
The VIX Flip is telling us the market leaders are in trouble.
Regards,

Michael Carr, CMT, CFTe
Editor, Peak Velocity Trader


