


Stocks defied expectations by moving higher this year. Most traders expected stocks to fall after the election no matter who won.
This is based on the presidential election cycle.
That cycle tells us stocks are usually weak following the election of a new president. That’s because the president comes into office and finds the economy is worse than expected. Then he takes difficult actions to fix the problem.
This was the case for many presidents. Ronald Reagan faced this problem and supported raising short-term interest rates above 19% in his first term. Right now, for comparison, short-term rates stand at about 1%.
And this year, President Donald Trump has avoided making difficult decisions.
Because of that, he has watched the S&P 500 gain more than 15% so far in his first year.
After a rally like this, investors are asking if more gains are possible. Well, there is some good news here. According to these two charts, more gains are likely.
Two Different Techniques
Small-cap stocks should be the biggest movers in a bull market.
Investors can buy the iShares Russell 2000 ETF (NYSE: IWM) for exposure to this sector. The charts below show IWM could gain another 7% in the short term based on two different techniques.
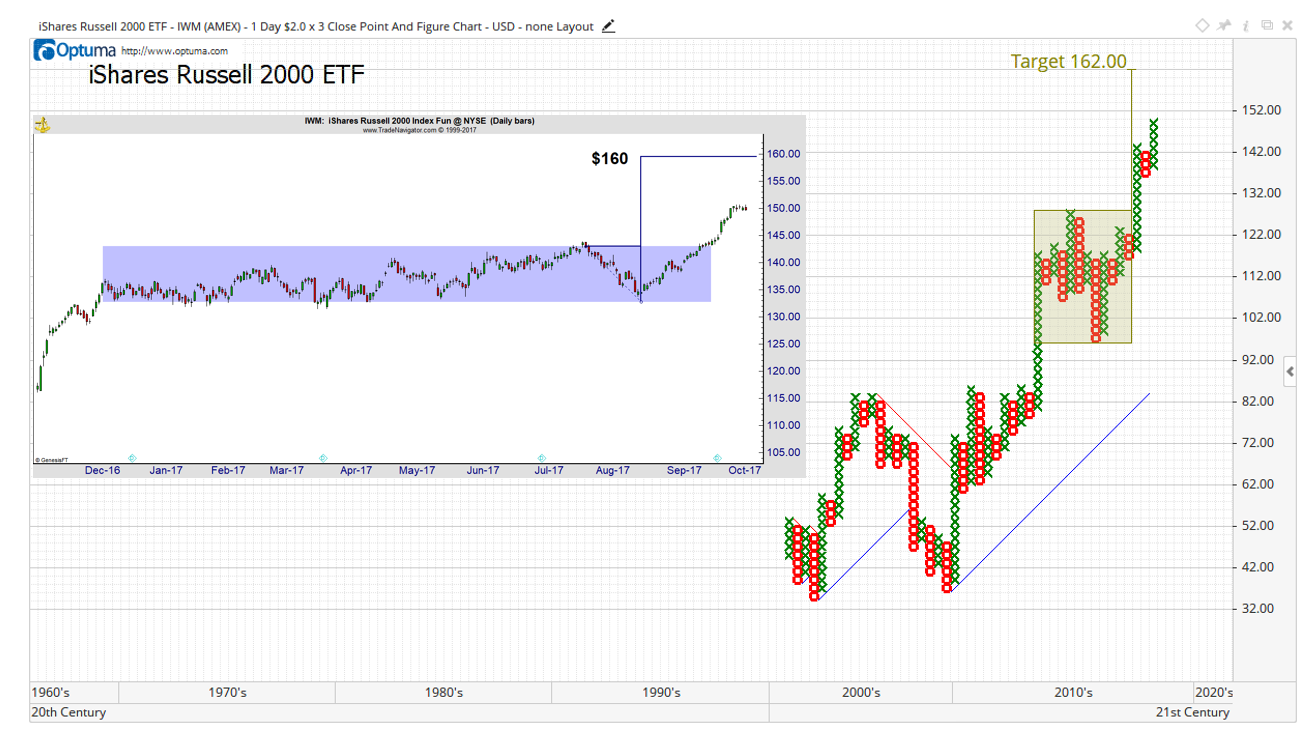
Technical analysts use chart patterns to find price targets. Any single chart could be wrong, so we usually use at least two charts. Right now, two independent techniques confirm the target for IWM.
On the left side above is a traditional bar chart. The blue rectangle highlights a nine-month trading range.
After breaking out, I expect the price move to equal at least the depth of the rectangle. This provides a target of $160, about 7% above the current price of IWM.
On the right side is a point and figure (P&F) chart. P&F charts ignore time and compress the price action, which makes them ideal for finding price targets. For IWM, the price target is $162, close to the target from the bar chart.
Targets on P&F charts also rely on the principle of symmetry. In this case, a yellow rectangle highlights the trading range. Here, we take the width of the pattern to find the target. Projecting upward from the breakout point, the target is $162.
When two techniques provide essentially the same target, as these two do, traders have a high degree of confidence in the direction of the trend.
For now, the trend is up, and it’s reasonable to expect a gain of 7% in the next three months.
Regards,
Michael Carr, CMT
Editor, Peak Velocity Trader