
The stock market just had its best week since October 1974.
But that historic 12% rally came as more than 17 million people filed for unemployment benefits in the past four weeks. That far surpasses the previous record of 2.7 million.
It turns out that 1974 also had a jump in unemployment claims.
As the markets surged that year amid a weakening economy, the Federal Reserve Chairman Arthur Burns told Congress that the situation had “no precedent in history.”
He was right. Both today’s and 1974’s events are unprecedented.
However, there’s useful information in studying unprecedented historical events that share some similar pieces.
So I started analyzing periods when unemployment claims changed quickly. I went back decades … and I found a trend in stock prices.
That trend is important. It gives us a clue as to how stock prices will react in the months ahead…
A Look at Unemployment Over the Last 50 Years
At the bottom of the following chart is an indicator measuring the momentum of changes in new unemployment claims.
Sudden Shifts in Unemployment Since 1970
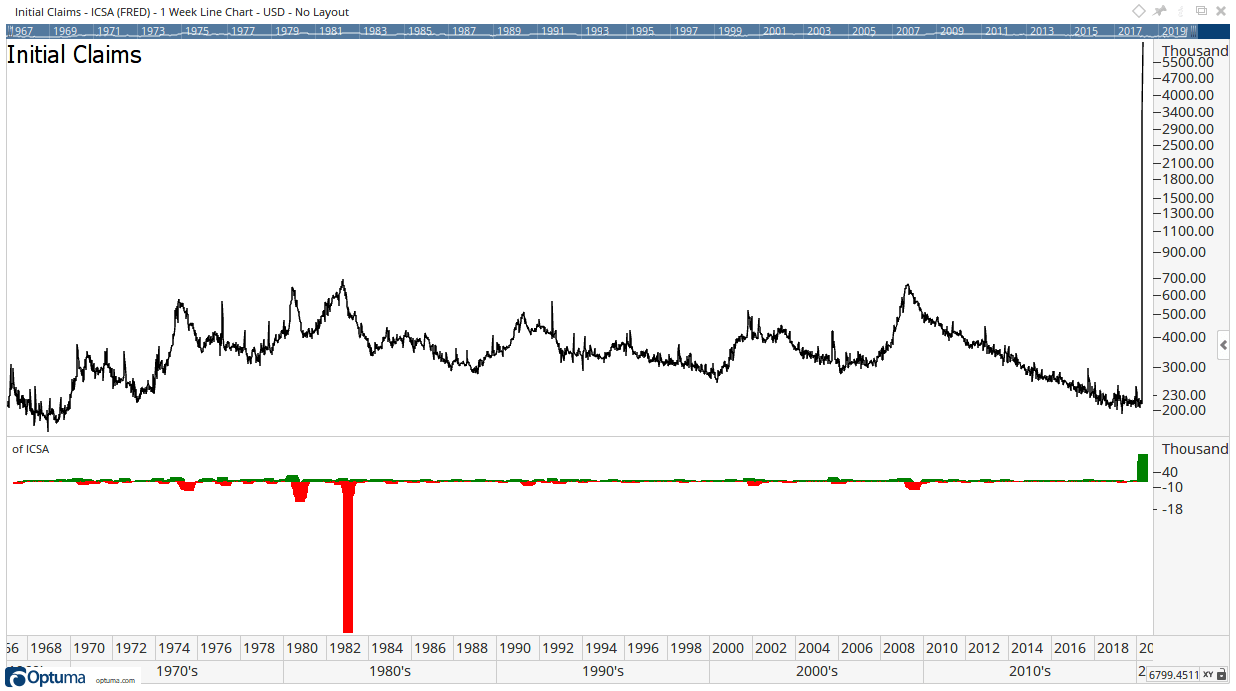
The green bars show periods when unemployment claims rose rapidly, while the red bars show when claims quickly decreased.
The next chart shows the S&P 500 Index. Blue bars highlight large changes in momentum of new unemployment claims. At those times, trends are visible in the S&P 500.
How Stocks Reacted to Major Unemployment Shifts
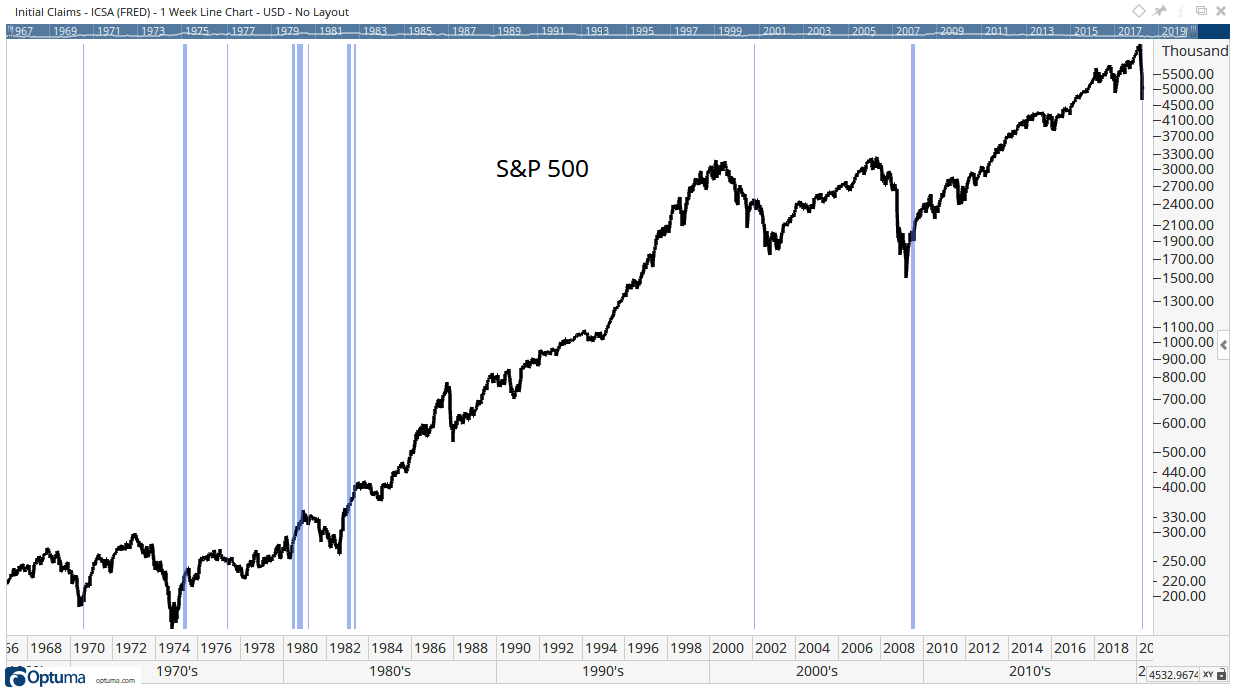
To interpret the chart, it’s important to remember that stock prices look ahead. That means today’s price theoretically reflects future conditions.
The same is true for an overall trend. If the trend is up, traders expect higher earnings six months from now. Downtrends show expectations of lower earnings.
So what does the above chart tell us?
Most of the big changes in unemployment claims were positive signs for the economy.
Six of the seven major changes, counting multiple signals within one year as a single instance, occurred when unemployment claims suddenly dropped.
In each of those six cases, stocks were already in uptrends. And they continued in uptrends.
The one bearish example came in late 2001. Unemployment claims jumped after the attacks on the World Trade Center and the Pentagon.
Stock prices were already in a downtrend at that time. This confirms that prices reflect the future. We were in a recession in 2001, and stocks continued to fall for more than a year after the attacks.
That tells me something important about the future of the stock market…
Stocks May Have Rallied … but There Are More Falls to Come
History shows that big changes in new unemployment claims highlight future economic trends.
For now, the overall price trend since the start of the year is down. The extreme jump in new claims supports that. It says the economy changed suddenly.
And it tells us to expect more weakness in the economy — and the stock market. Wednesday’s sudden drop, as investors reacted to plunging retail sales supports that.
Until new claims drop significantly, expect additional declines in the economy and the stock market.
Regards,

Editor, Peak Velocity Trader
P.S. On a day when the market fell 600 points, my One Trade strategy delivered a 113% gain by that afternoon. That’s because with One Trade, it doesn’t matter which way the market is going. Up or down, it gives you the opportunity to target gains of 100% or more every single time. If you’d like to be one of the first people to learn how my One Trade strategy works, click here to sign up for my free presentation.