
October was the worst month for the S&P 500 Index since September 2011. The tech-heavy Nasdaq Composite Index suffered its worst month since November 2008.
Prices quickly bounced higher off the lows. Many investors saw the bounce and thought the worst was behind us. They thought the bull market was not yet over.
But history shows strong up moves are most common in bear markets. So, a short rally in stocks is more evidence that the bear market arrived.
That view is consistent with other evidence.
Earnings growth is slowing. That’s bearish. Stocks are overvalued, and that’s bearish when earnings growth slows.
There are also a variety of technical indicators pointing to a decline in the stock market.
Earnings and Valuation
Company earnings drive stock prices.
When companies grow earnings, stock prices go up. When earnings aren’t growing, prices fall.
This year, analysts expect earnings growth of 20.6%. Next year, they expect earnings growth of about half that, just 9.4%.
Earnings growth rates affect stock pricing models. Slower growth means stocks deserve lower valuations.
But, right now, the S&P 500 is trading at a higher-than-average valuation. Based on expected earnings, the index is trading with a price-to-earnings (P/E) ratio of 15.6. Over the past 10 years, the average P/E ratio was 14.5.
By this simple measure, the S&P 500 is at least 7.6% overvalued. That means a decline of 7.6% would get the index to an average valuation.
To reflect below-average growth, a steeper decline is likely.
Technicals Point to a Bear Market
Technical analysts focus solely on price action. The chart below shows one bearish interpretation.
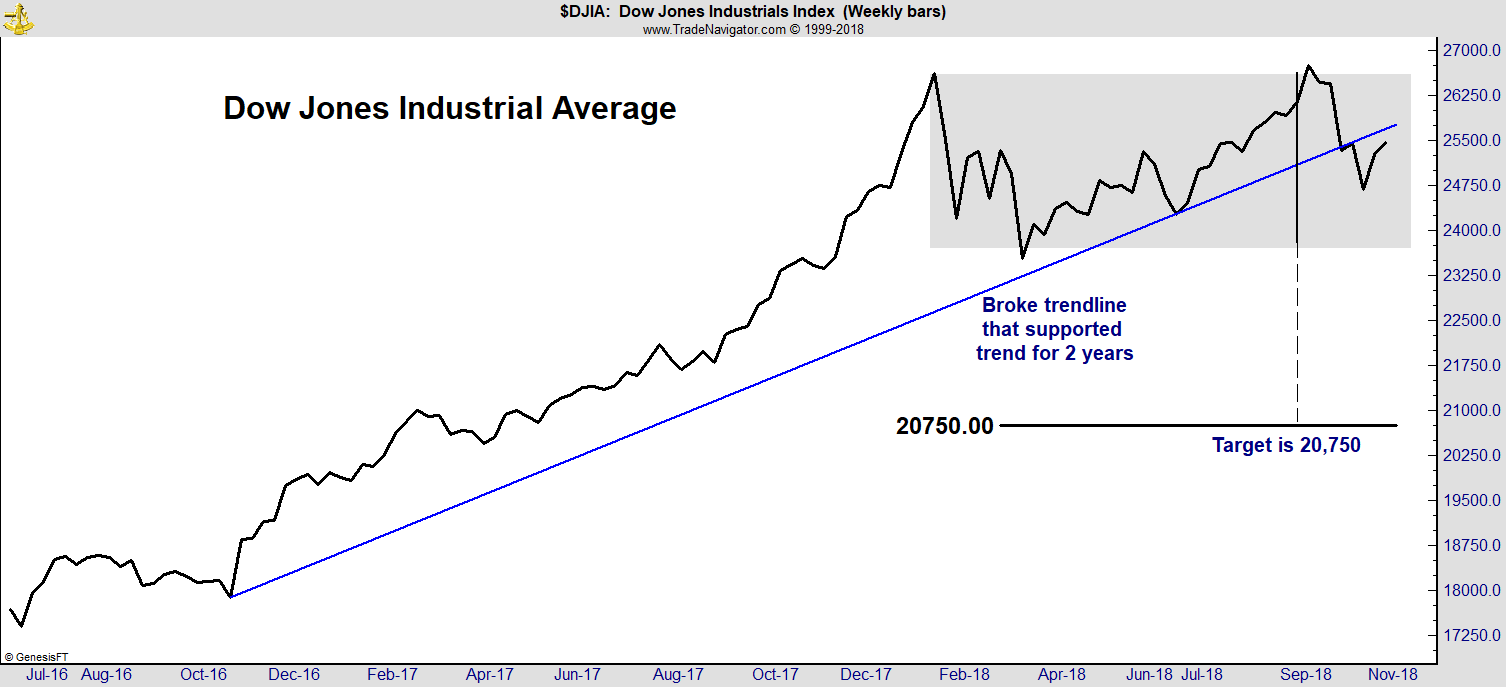
October’s sell-off pushed the Dow Jones Industrial Average below a trendline that supported the uptrend for two years. The price pattern shows a price target about 18% below the current price.
Those are just two concerns technical analysis highlights. Market breadth also broke down. I highlighted this indicator last month.
Reliable momentum indicators are on sell signals.
I also recently wrote about my VIX Flip indicator signaling a bear market. VIX Flip shows changes in the emotions of traders.
The indicator shows whether traders are more greedy or fearful. When the level of fear in the market is rising, prices are usually falling.
Applied to the S&P 500 and other major market averages, this indicator remains bearish on daily, weekly and monthly charts.
Finally, there was the sell signal in the market leaders I wrote about last week. The five stocks that led the market higher — Facebook, Apple, Amazon, Netflix and Alphabet (parent of Google) — broke down. Now, they are set to lead the market lower.
An Important Profit Opportunity
These are just some of the indicators pointing to the bull market’s end. But there’s some good news.
Market prices never move in a straight line. There will be short uptrends even while the long-term trend is down.
These brief uptrends offer opportunities to close out positions that have profits, or to reduce losses. They create openings for short-term trades.
Options are ideal for the end of a bull market. They can be less risky than buying stocks.
Options can also generate profits when prices fall. Since the long-term trend is now bearish, that’s an important profit opportunity.
Regards,

Michael Carr, CMT, CFTe
Editor, Peak Velocity Trader