The FAANGs were in a bubble for the last year.
These are the stocks that led the market higher — Facebook, Apple, Amazon, Netflix and Alphabet (parent of Google).
Bubbles are times when prices race higher, ignoring the fundamentals.
They start based on rational assessments. It’s rational to expect the FAANGs to deliver big profits. These are companies creating new markets.
Facebook connects people and companies on social media.
Apple created the iPhone.
Amazon created a store selling everything from the cloud.
Netflix created streaming entertainment.
Google created the ability to target ads based on search histories and extremely personal data.
Collectively, the stock prices of the group reflected hopes for the new markets. And a bubble developed.
But the bubble reached irrational peaks. All bubbles do. And the chart below shows the bubble popped.
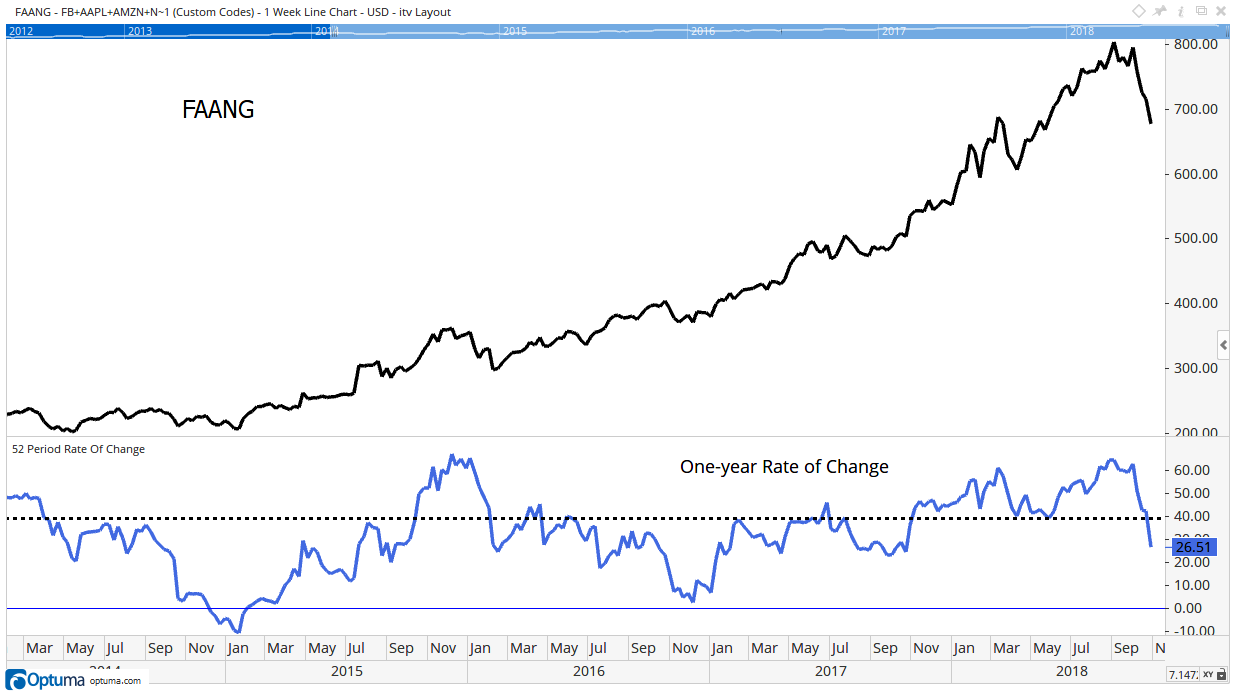
The chart shows an index of the FAANG stocks. The index averages daily price changes in the stocks. At the bottom is the one-year rate of change (ROC) indicator.
The dashed line marks the 40% level. When prices are 40% higher than they were a year ago, we are in a bubble. That’s simply because companies cannot grow sales and earnings at 40% a year for extended periods of time.
Bubbles can last for months or even years. Because a bubble becomes irrational, there’s no way to forecast when it will pop. But ROC signals after it pops.
History shows when the one-year ROC drops back below 40%, the bubble is over. At a minimum, prices move sideways after that. More often, prices fall sharply after the indicator gives its sell signal.
The recent market sell-off pushed the ROC of the FAANG index under 40%. That’s the sell signal in the FAANG bubble.
Since the FAANGs make up so much of the major market averages, that means the stock market is in a downtrend.
Regards,

Michael Carr, CMT, CFTe
Editor, Peak Velocity Trader