Sentiment indicators can help give us an idea of the underlying tone in the market.
There are plenty of investor sentiment indicators out there to track. CNN’s Fear and Greed Index, the AAII Investor Sentiment Survey, the CBOE Volatility Index or even a simple 200-day moving average.
We also track consumer sentiment closely, most commonly through the University of Michigan Consumer Sentiment Survey.
The number of sentiment indicators goes on and on, but the point is that sentiment is robustly tracked and used in trading.
However, there aren’t many easy-to-access indicators that successfully track sentiment from corporations. Much less a culmination of earnings calls.
Now UBS is reporting on just that: the general sentiment from more than 100,000 earnings calls of companies in the S&P 500 Index.
Earnings calls happen every three months, where a company will lay out its thoughts and details about its business.
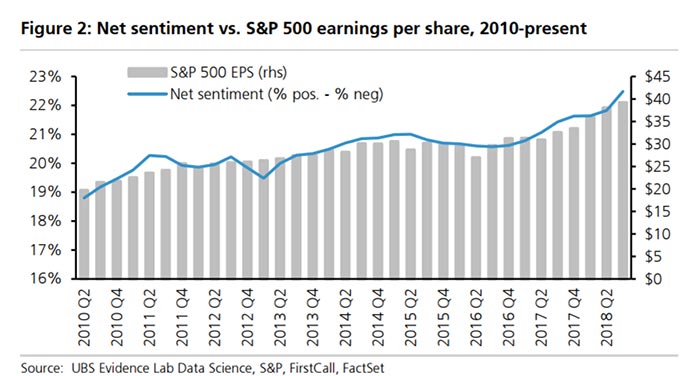
UBS found a way to decipher the tone, or sentiment, from those calls and pulled the data together in the chart below.
Take a look:

The solid blue line is the sentiment from earnings calls, and you can see it is surging higher after the latest earnings season. The gray bars show the earnings per share of the S&P 500, which has risen steadily over the last six quarters.
Upcoming Earnings Season
This is great news for the upcoming earnings season, as this positive earnings sentiment points to a continued rise in S&P 500 earnings growth.
You see, even though first-quarter earnings were phenomenal, they failed to lift the S&P 500 to new highs.
But another rock-solid quarter of earnings, as the sentiment indicates we will see, will surely do the trick.
Now’s a great time to have exposure to the stock market to ride the next big push higher.
Regards,

Chad Shoop, CMT
Editor, Automatic Profits Alert


