I follow the CBOE Volatility Index (VIX) constantly for my premium service Pure Income. It gives me vital information on broad market expectations that I, in turn, can use to generate significant income for my readers.
The VIX is a simple measure of S&P 500 put option buying versus call option buying, with put options considered bearish bets and call options bullish. When the VIX is high, it signals investors are rushing to buy put options, hedging their portfolios for a crash.
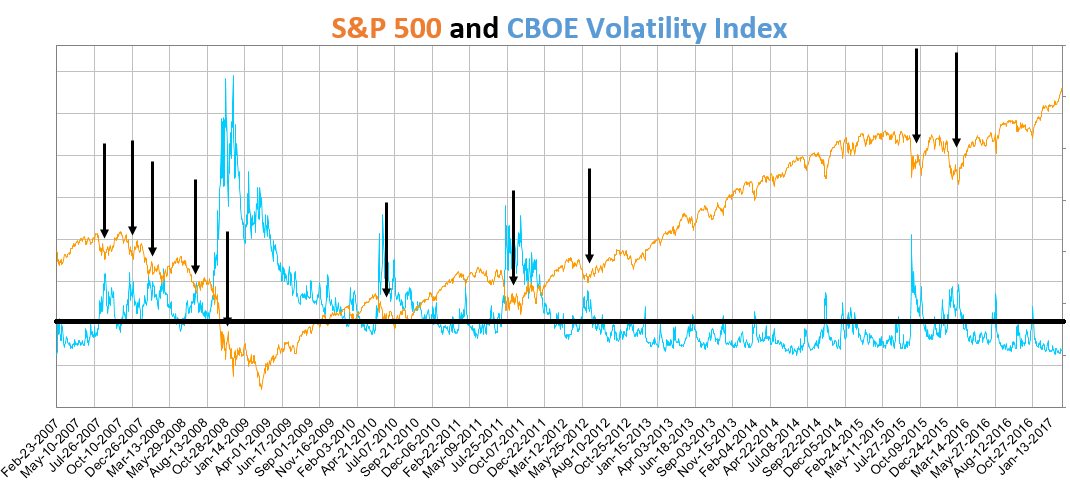
As you can see in the chart below, these investors usually show up en masse when the market is already selling off. Take a look:

The arrows show market dips in the S&P 500 (the orange line), and you can see they correlate to spikes in the VIX (the blue line). The horizontal black line shows the 20 level for these indexes.
Here’s a quick guideline:
If the VIX is low, as in below 20, investors anticipate stocks will continue to go up as they have been.
If the VIX is high, as in above 20, investors are nervous about the rally, and stocks are already pulling back.
It’s important to realize that the VIX isn’t necessary a leading or lagging indicator. It’s a coincident indicator, which means it moves simultaneously with the market.
Following the chart, those spikes in the VIX were actually good buying opportunities, even during the 2008 financial crisis. The level at which to jump in is questionable, but a good rule of thumb is the 20 level mentioned above.
You should get out when the VIX moves above the 20 level, and you can look to get back in when it comes back down to 20 or below.
Regards,
Chad Shoop, CMT

Editor, Pure Income


