Mark Twain is reputed to have said: “History doesn’t repeat itself, but it does rhyme.”
If there’s anything here that could be repeating itself, it’s the inability of the tinkering Federal Reserve to get through a rate-hike cycle without crashing the market.
As we’ve seen from the recent past, the market might not respond immediately. However, the past two rate-hike cycles saw the S&P 500 correct by 50%.
There is a growing concern among investors that newly appointed Fed Chair Jerome Powell and his merry band of central bankers (or banksters, for “end the Fed” types) will put an end to the stock market rally by increasing the fed funds rate. In the U.S., the fed funds rate is the rate that banks lend to one another, and can be looked at as the cost of money.
While not an exact science, interest rates affect the economy by influencing consumer and business spending, and thereby funneling down to changes in stock and bond prices. When interest rates are higher, business and consumers typically save more and spend less, which can be detrimental to economic growth, thus, causing a market crash.
In that light, let’s take a look at previous rate-hike cycles to evaluate their impact on stock prices.
Irrational Exuberance
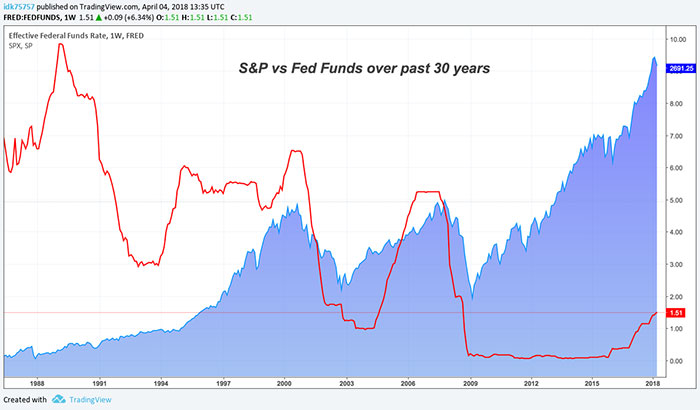
The following chart shows the S&P 500 in blue versus the fed funds rate over the past 30 years.

The first thing to note is that the beginning of the bull market, which has returned over 800% to investors over the past three decades, coincided with a drop in the fed funds rate from 10% in the late ‘80s to 3% in the early ‘90s. The economy was in a deep recession under President George H. Bush, and Alan Greenspan’s Fed was doing its best to cut rates and revive economic growth.
From 1995 to 2000, Greenspan kept the target rate around 5%, and the S&P 500 tripled. Even though he warned of “irrational exuberance” in stock prices in December 1996, he kept rates on hold for half a decade.
May 2000 was the first time the Fed raised rates in that cycle by 50 basis points to slow down an overheating economy.
It may have gone too far, too fast as the ensuing stock market sell-off (and dot-com bust) led to a 50% decline over the next two years.
The Subprime Scar
As the market and the economy bottomed in 2003, the Fed left rates at 1%, fearing an aggressive move would lead to the same outcome as 2000. This easy-money policy was a key factor in the housing bubble of 2004 to 2006, which drove both stock and home prices higher.
Fearing the Fed was behind the curve, Greenspan aggressively raised rates from 1% to 5.25% between 2004 to 2006, and then tossed the keys to Ben Bernanke.
In May 2007, Bernanke said that “the effect of the troubles in the subprime sector … will be limited, and we do not expect significant spillovers from the subprime market to the rest of the economy or to the financial system.”
Only a month later, Bear Stearns was forced to rescue two subprime mortgage funds, and the Fed began lowering rates.
The subprime scare wasn’t enough to immediately impact the market, as the S&P 500 continued to rally (with confidence in Bernanke) and finally recaptured its 2000 high in September 2007.
However, traders’ “S&P 1500” hats were put away as quickly as they’d been dusted off, as the market began falling in late 2007 and then continued to drop by more than 50% in the next year.
An Era of Free Money
Extraordinary times require extraordinary measures. By January 2009, the Fed had aggressively dropped rates from 5.25% to 0%. This is also known as the zero lower bound, or ZLB.
The ZLB ushered in an era of free money and an assortment of kabuki dances, also known as quantitative easing (QE).
In these abstract monetary experiments, started under Bernanke and continued under Janet Yellen, the Fed purchased longer-dated Treasurys, mortgages and corporate bonds. This was an effort to force investors (namely, pension funds and insurance companies) to search for more yield, thereby reflating stock, bonds and housing prices.
In finance, another way to say “search for more yield” is “take more risk.”
For the past decade, the Fed’s monetary policy has been the only game in town — inflation has been benign, and the economy has been sputtering along at around 2% growth. Any bears who fought the Fed were eventually steamrolled by rising asset prices.
Investors developed cute acronyms like TINA (“there is no alternative”) to justify purchasing stocks. At a price-to-earnings (P/E) ratio of 31, the S&P 500 is at the highest Shiller P/E since 2000, or the most overvalued.
From the March 2009 bottom, the S&P 500 gained nearly 400%. There’s been nothing to worry about because the Fed has your back.
When complacency reigns supreme, it’s time to start worrying about stocks.
The Bottom Line for the Federal Reserve
The latest round of QE ended in late 2014, and the Fed now controls $4.5 trillion in assets. On top of that, rates are finally off the lower bound and headed higher. The fed funds rate is now between 2% and 2.25%, with another rate hike expected by the end of the year.
If history is any guide, the last two rate-hike cycles in 2000 and 2004 to 2006 eventually brought about 50% stock market corrections.
With an overvalued market and potential trade war brewing, why will this time be any different?
Or as Mark Twain once quipped: “Whenever you find yourself on the side of the majority, it is time to pause and reflect.”
Regards,

Ian King
Editor, Crypto Profit Trader


