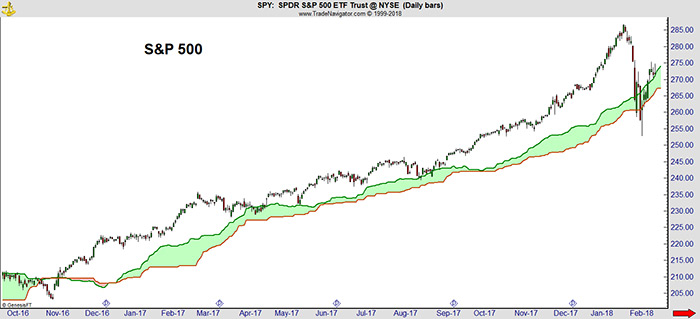
Ichimoku cloud charts are not widely known among individual investors. But they are the sixth most popular indicator on the Bloomberg Terminal. In Asia, they are the most popular charting style on Bloomberg.
Professionals use cloud charts because they are easy to interpret. In the past week, the Ichimoku cloud charts gave a buy signal in the S&P 500 Index.

Cloud signals are rare. The last one came in November 2016, before the rally that ended earlier this month. The signals are also relatively reliable.
The index is higher about 70% of the time one month after a buy signal. On average, the S&P 500 is higher about 61% of the time in a random one-month period
Clouds are a series of moving averages shifted forward and backward in time. A Japanese analyst developed the technique in the 1960s. The analyst was searching for the perfect market indicator. Clouds are far from perfect, but they are useful.
A price move above or below the cloud is a signal. The chart above shows the most recent sell-off on February 6. A buy signal quickly followed just a week later.
The fact that clouds are popular on Bloomberg makes them important. Market professionals controlling trillions of dollars use Bloomberg terminals. Knowing what professional managers are looking at offers insights into what the professionals are doing.
Based on cloud charts and recent price action, professional investment managers are buying. As individuals, we should be buying as well.
Regards,

Michael Carr, CMT
Editor, Peak Velocity Trader


