In the long run, earnings are important to the stock market. But in the short run, earnings don’t matter much. In the short run, stories drive stocks.
Lately, the inverted yield curve has become a big story.
Google Trends shows that interest in the inverted yield curve recently reached a 10-year high. Many investors search for that term because they think it signals a bear market.
But that’s not the full story. History shows an inverted yield curve is a buy signal.
The Price of Money
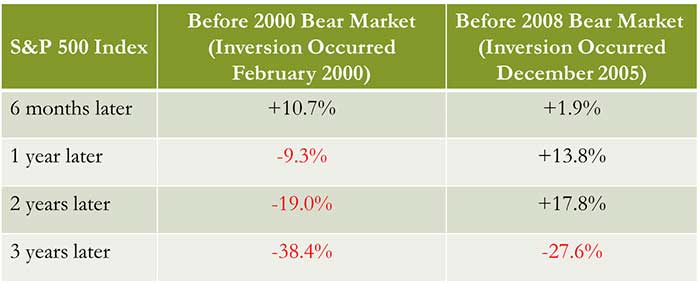
Before explaining why an inverted yield curve won’t be a sell signal, let me share some data. The last two times the yield curve inverted, the S&P 500 Index moved higher for the next six months.

Now, let’s drill down and see why what everyone knows about the yield curve seems to be wrong. To do that, I’ll start with the definition.
The yield curve shows the price of money over time. It charts the difference between interest rates on bonds with different times to maturity. A popular yield curve is the 10/2, which compares the yield of the 10-year Treasury to the two-year Treasury.
Yields on the 10-year are usually higher than yields on the two-year. That’s because there’s more risk that things can go wrong over 10 years than there is in two years.
When the 10-year yield falls below the two-year yield, the yield curve inverts. In the past, that meant investors were worried about the short-term outlook for the economy, but they were still confident about the long term.
Bonds can be confusing, so let me walk you through the impact this has on prices.
This Time Is Different
Higher confidence in the long-run outlook meant investors were more willing to buy 10-year Treasurys than two-years. That willingness to buy increases demand for the 10-year, and concerns about the short run decrease demand for the two-year.
It’s important to remember that when the price of a bond rises, the interest rate falls. Lower demand indicates prices should fall and rates will rise.
Increased demand pushed up the price of 10-years, and the yield fell. At the same, with fewer buyers for two-years, prices of those notes fell, and the yield rose.
That caused the yield curve to invert. Now let’s look at what the yields on a Treasury tells us.
In the past, Treasury yields were based on two factors. There was a return on investment, usually 2% to 3% a year. Then there was a factor compensating investors for inflation. This term varied based on how worried investors were about inflation.
This time is different. The return on investments fell to historic lows as the Federal Reserve pushed interest rates to zero. That means Treasury yields are now based almost solely on inflation risks.
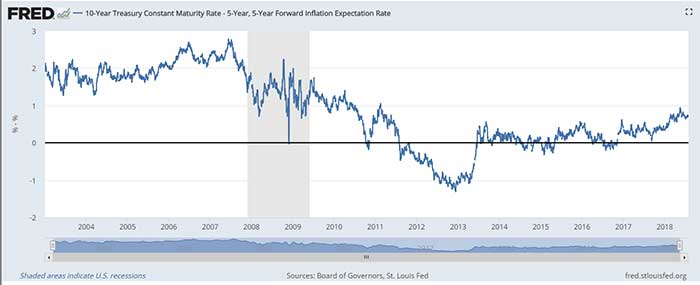
The chart below shows the yield on 10-year notes minus the market’s inflation expectations. Notice how the character of the line changed during the 2008 recession.

(Source: Federal Reserve)
Prior to the recession, the line was always close to 2%. Then, it fell. In 2010, investors stopped worrying about a return on their money. They started buying Treasurys for safety rather than income.
When the chart shows a negative value, investors are paying the government to hold their money. That’s not how bonds are supposed to work. But it shows why this market is different than previous markets.
So, when the yield curve inverts, investors should ignore the doomsayers. They should remember that this time is different.
They should also remember that even if a bear market does eventually follow an inverted yield curve, they have at least six more months to enjoy gains. So, if the yield curve inverts, buy.
Regards,

Michael Carr, CMT
Editor, Peak Velocity Trader


