The best way to measure growth is also the simplest: sales growth.
That’s the first line a company puts on its income statement. And with each line below that, it’s easier to manipulate numbers and fake growth. But with sales, it’s much rarer: The company either sold something or it didn’t.
And right now, we’re seeing one of the biggest sales growth rallies in history.

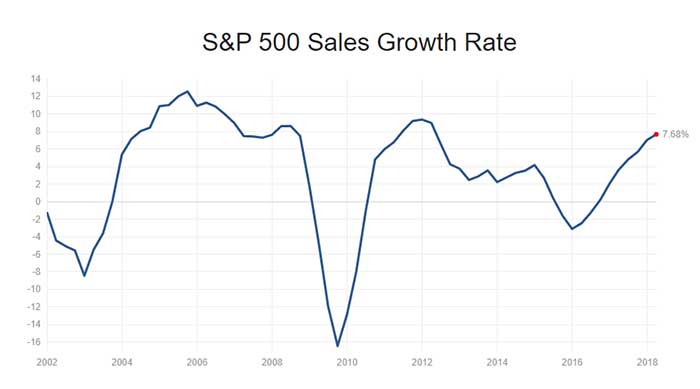
The chart above doesn’t reflect this quarter, which is 9.8% so far as of last Friday. That’s one of the best in the past 20 years.
And I’d argue it’s the best. Unlike the previous two times on the chart we got to that level, we’re not coming out of a recession.
It’s not as hard to post 10% growth when your sales for the past couple of years were down 8% to 16%, like they were in 2002 and 2009.
If you sell $100 worth of something one year, and the next year you sell $90, that’s a 10% drop in sales. And then if you sell $99 the next year, that’s 10% growth. That looks good on paper, but you didn’t actually grow.
Now we’re nearing 10% growth coming off a low point of about negative 3%. That means we’ve had steady, compounding growth for almost two years, with no sign of slowing. To me, that means the market can continue to go up.
Another reason for this growth is the huge shift in technology we’ve seen in the past three to four years. Things like solar power, the Internet of Things and automation have driven sales of new tech gadgets through the roof.
Even simple things like Amazon Prime have revolutionized e-commerce, and now people are buying goods from home more than ever. That convenience has surely had an impact on sales growth. And now, it’s arguable that companies have to have a good online presence to even stay afloat.
The bottom line is, with this kind of sales growth, there are good opportunities out there to invest. The simplest way is with the iShares S&P 500 Growth ETF (NYSE: IVW), which has almost doubled the market’s return so far in 2018.
Regards,

Ian Dyer
Editor, Rapid Profit Trader


