
The end of the second quarter is approaching — and in just three months, we’ve witnessed a series of unprecedented events that no one would have expected.
Economic data is worse than the Great Depression, yet the market is approaching an all-time high.
COVID-19 has arguably been the biggest black swan event in the past 100 years. As its magnitude became realized and uncertainty loomed, the CBOE Volatility Index (VIX) surged.
The VIX indicates the market expectation of the market’s price change over the next 30 days. It’s regarded as a fear gauge and provides implied volatility.
The VIX can be used to determine how much the market is expected to move in a day, in either direction.
As it turns out, reality is often different than expectations, though.
The chart below shows the difference between actual and implied daily movement. A flat line would imply no difference:
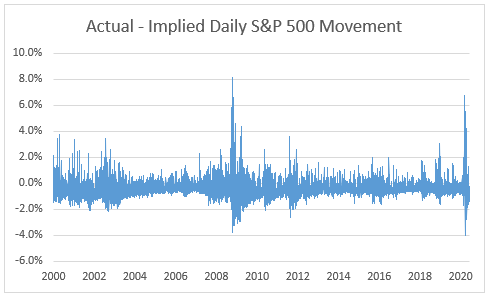
(Source: Bloomberg)
As you can see, implied volatility is rarely the same as realized volatility.
This sets up profitable opportunities for investors who realize implied volatility (fear) is typically greater than the reality.
Fear Has Been Good for the Stock Market
On average, implied volatility suggested 0.4% more movement than actually occurred each day. This means that fear is generally higher than it should be.
Since the 600% spike in the VIX during March, the S&P 500 Index has rallied over 40%.
In fact, extreme differences between realized and implied volatility have generally been associated with tremendous buying opportunities.
With the VIX still twice as high as it was before the COVID-19 crash, fear is still evident. This suggests further stock market gains are ahead.
Following the VIX spike during the 2008 market crash, the VIX hovered around twice the pre-crash levels for about three months after the S&P 500 Index bottomed.
By the time the VIX reached pre-crash levels in 2010, the market had increased 79% from the low. During this rally, implied volatility was higher than realized volatility 83% of the time.
Like Mark Twain said: “History doesn’t repeat itself, but it often rhymes.”
A New Way to Trade Market Volatility
The stock market averages about 8% to 10% per year.
But Michael Carr’s new One Trade strategy made 30 times that much in one day.
Considering you place the same trade on the same ticker symbol every time … it’s easy enough that anyone can do it.
Michael is still putting the finishing touches on everything. But if you’d like to get a first look at his new research before everyone else, click here now to reserve your spot. (It’s free.)
Regards,
Research Analyst, Automatic Fortunes