

Fear over the coronavirus erased $1 trillion of value from the stock market. From Friday, February 21, to Monday, February 24, the market gave up its year-to-date gains.
I’m not telling you to run for the hills.
Invest your money. But please resist the mindless mantra that says investing is always an all-or-nothing wager.
Don’t let your guard down just because we’re in a bull market.
Do something to protect your investments during a market downturn.
Instead of moving to cash and waiting on the sidelines, consider something that lets you make more than 100% on short-term trades while stocks fall.
Doing this is a matter of knowing when and how to act.
Let me show you with two indicators on this chart of the S&P 500 Index.
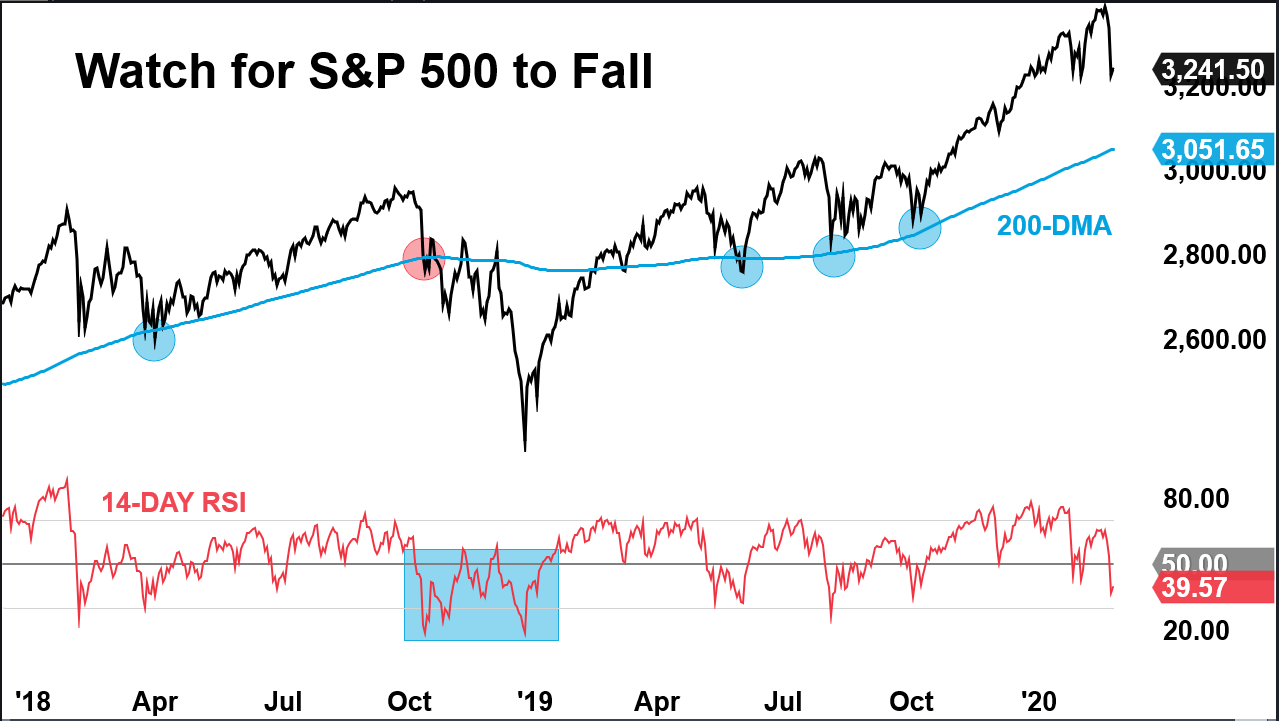
2 Bearish Indicators to Watch For
The blue line is the 200-day moving average (MA). It denotes average prices over the most recent 200 days.
This is a great indication of trend.
When the stock or index is above its 200-day MA, it’s in an uptrend. And it’s in a downtrend if it’s below its 200-day MA.
In past declines, the S&P 500 found price support at its 200-day MA … and then the uptrend continued from there.
Back in 2018, however, the S&P 500 broke below its 200-day MA and continued to fall.
Today, the S&P 500 must fall another 6% before it reaches its 200-day MA.
Be on the lookout for this. It helps you decide when it’s time to protect your investments.
Another indicator to watch is the relative strength index (RSI), the red line on the chart.
RSI measures the strength of a trend. It averages gains and losses over a given time.
It’s called a price oscillator because it moves up and down between 0 and 100, levels of extreme weakness and extreme strength.
A trend is strong if the RSI is above 50 and rising, and weak if it is below 50 and falling.
The S&P 500’s 20% decline at the end of 2018 lasted for about three months. During that time, its 14-day RSI struggled to get back above 50 … and even reached extreme weakness below 30 several times.
This week, the S&P 500’s 14-day RSI fell below 50.
This means it’s time to prepare for a downtrend.
Look for confirmation of the market’s weakness. For example, watch to see if the S&P 500 falls below its 200-day MA.
Then make a defensive play. Even better, go on offense.
An Offensive Strategy to “Buy on Red”
The coronavirus is an unpredictable event. The outbreak has made its way from China and into South Korea, Iran and Italy.
It’s threatening the global economy and pushing stocks lower.
Most investors will shift money into less risky investments.
It’ll mean mediocre returns at best.
But you don’t have to settle for that.
There is big money to be made when stocks are falling.
We designed an options trading strategy for these kinds of events.
Prices go up, and they go down. We can make money in both directions.
We use options to capture double- and triple-digit gains when stocks are falling.
These “buy on red” trades shine at rough spots for individual stocks, especially when the broad market is falling.
You can apply our strategy for potential short-term gains — profits to help offset portfolio declines when a global crisis like the coronavirus is knocking at our door.
If you’d like to learn more about our Apex Profit System, email us at winninginvestor@banyanhill.com.
Good investing,

Editor, Apex Profit Alert