
The last few years have made it very difficult to be a naysayer of Tesla (Nasdaq: TSLA).
It dominates the electric vehicle (EV) space. It’s hard to drive anywhere without seeing at least one of them on the road. Not to mention, its stock price is up nearly 1,400% in five years.
But there’s little chance Tesla will hold this position forever. America’s legacy carmakers, late to the EV game as they are, are ramping up their efforts to put true EV competition on the road. And the runaway success of TSLA as a stock makes this push all the more enticing.
Naturally, traders have looked to bank on this trend by buying some previously unloved automaker stocks ahead of this surge in competition…
And today’s Bank It or Tank It is all about one target in particular.
Is This Stock’s Recovery Justified?
As a prime example, Ford Motor Company (NYSE: F) is pulling out all the stops to be a potential new leader in the electric vehicle space.
It has new EV lineups coming in the popular F-Series pickup trucks and a new SUV branded after its leading muscle car, the Mustang. The company is also reimagining the classic Bronco for the modern car buyer.
But due to pandemic-related supply issues, Ford is struggling to get new vehicles in dealerships across America. That’s causing it to miss out on the rush we’ve seen in car buying. With inventory so low, consumers simply don’t have enough selection to get the car of their dreams.
And it shows in the numbers. Last quarter the company experienced a 26% drop in sales from a year ago.
That’s when the pandemic hit. And it still saw sales drop sharply even compared to that previous quarter.
Clearly Ford is struggling to boost sales with fewer cars on the lot. At some point, investors are going to question the “V” recovery in the share price.
But are those questions justified? Or does Ford have some room to run here?
Let’s dive deeper…
Ford’s Big Problem
Probably the biggest issue for Ford has been chip shortages.
The pandemic has weighed heavily on chip production. First manufacturers shut down, then shipping bottlenecked.
These two factors have caused a lingering chip shortage across the board. And with new vehicles requiring these chips for even basic functions, the result is a lack of new vehicles being produced.
In a recent press release, Ford said it will be rolling out more vehicles later this year. But it could be too little, too late.
Even as consumers have rushed to buy new vehicles with low financing rates and high trade-in values, Ford has largely missed out due to these inventory problems.
We can see from revenue and net income that 2021 is a struggle — much like 2020…
Key Stats: Net Income and Revenues
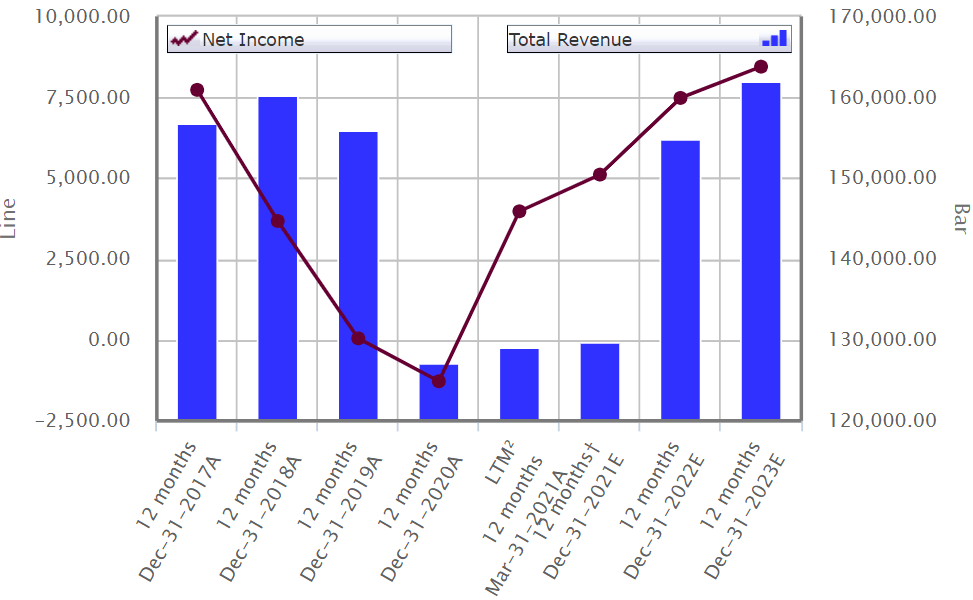
(Source: S&P Capital IQ.)
(Click here to view larger image.)
Net income — the line on the chart — is starting to come back in 2021 as the company was able to trim some labor costs after the pandemic.
But revenues, which should lead any growth in net income, is expected to basically stay flat in 2021 compared to 2020. And Ford isn’t expecting revenue to return to pre-pandemic levels until 2022.
That hasn’t stopped investors from being bullish on the stock, however. Shares are up more than 250% from their March 2020 lows.
The only problem is that, as long as the rebound in revenues remains in the “expected” column, investors could start questioning the V-shaped rebound the stock has seen.
That’s what makes Ford such an interesting case, and why it’s the subject of my latest Bank It or Tank It.
In today’s video, I’ll dive even deeper and break down what you can expect from Ford in these uncertain times.
I’ll let you know how it stacks up to its competitors, what the investor sentiment is and key levels to watch. Click here or the thumbnail below to check it out.

Regards,
Chad Shoop
Editor, Quick Hit Profits
P.S. To get content like this in your inbox everyday, subscribe to True Options Masters. Click here and subscribe.
Chart of the Day — A Surefire
Sign of Volatility
By Mike Merson, Managing Editor, True Options Masters
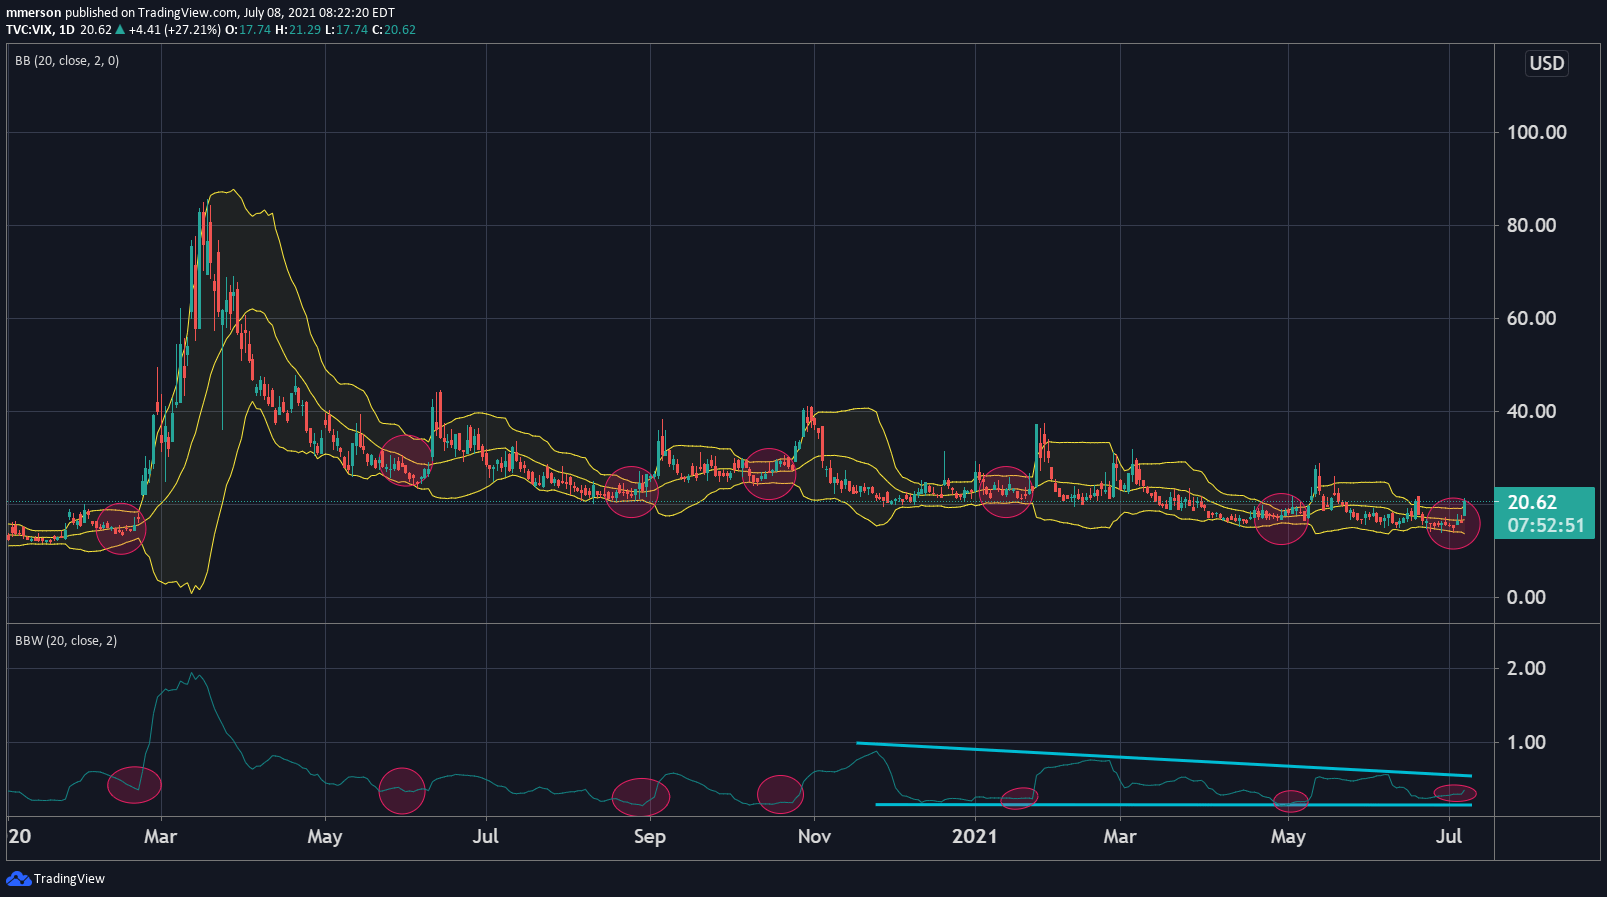
(Click here to view larger image.)
Today’s chart is on the CBOE Volatility Index (VIX) — commonly known as the investor “fear gauge.”
Now, while you can’t use the all the same technical tricks to read the VIX as you can to read stock charts, there are a few techniques that are helpful in predicting big moves.
The one I want to highlight today is the Bollinger Bands. These bands show the relative volatility or trading range of a specific asset or index. Used here, you can think of them as a way to track the “volatility of volatility.”
And they present a consistent pattern…
Notice how, whenever the bands contract on the chart of the VIX, that tends to signal a surge in volatility. You can see this happen in each of the pink circles in the chart above.
And by reading the Bollinger Band Width (BBW) below the chart, we can see the precise levels that these bands contract to before volatility jumps.
Once again, pink circles indicate BBW lows. And over the past eight months, you can see the BBW has made lower highs and similar lows — showing how the average width has contracted over time.
I was talking about this chart yesterday with Mike and Chad. I mentioned we could easily see the VIX at 20 in the next week.
Lo and behold, this morning the VIX popped to 20.62. And equity markets are blood-red.
Whenever you see these bands contract on the VIX, buying puts on the major market index exchange-traded funds (SPY, QQQ, DIA) would be a good protective measure.
Best,
Mike Merson
Managing Editor, True Options Masters