
I’m a born citizen of the United States, and a naturalized citizen of South Africa.
Superficially, they seem like very different places. But under the hood, there are some striking similarities. Being in Cape Town for the last week reminds me of that.
Thanks to COVID, my last visit was two and a half years ago. I’ve been reacclimatizing.
I close the driveway gate as soon as I pull in to prevent somebody from following me in.
If I come to a red light late at night, I keep going to thwart potential hijackers.
I keep a wad of low-value bank notes in the glove box to tip so-called “car guards,” so they won’t scratch the paintwork if I don’t.
And the politics … well, let’s just say it’s not just the weather getting hot at this end of the world right now.
South Africa is drop-dead gorgeous. Its people are the salt of the earth. But it is one of the most unequal societies in the world, which makes it a challenging place to live … to put it mildly.
One thing I’ve learned in my travels is that when inequality reaches extreme levels, dire consequences follow.
So, when a new data set on inequality in the U.S. arrived in my inbox, I realized I had the makings of this week’s Bauman Daily.
If you doubt the relevance to growing and protecting your investments, read on…
Not Like the Old Days…
We human beings live long enough to experience major shifts in economy, society and politics. I know I’ve seen some.
Unfortunately, we don’t live long enough to see them happen more than once. That makes perspective hard to come by.
For example, the baby boomer generation grew up in the 1950s, 60s and 70s. For many Americans, it was a time of opportunity and increasing abundance. The post-war U.S. economy created enormous prospects.
We “learned” that every generation would achieve a higher standard of living than the one before. That shaped our expectations of what the world “should” be like.
But the world isn’t like that anymore.
The average American income has stagnated since the 1970s. Young people who’ve come into the labor market since the Great Financial Crisis struggle to maintain a decent standard of living … much less improve it over time.
That’s made a lot of people unhappy … and increasingly, they’re becoming angry as well.
And angry societies aren’t great places to invest.
…More Like the REALLY Old Days
America experienced a similar scenario after the Civil War.
Between 1865 and 1882, U.S. real incomes rose by approximately the same percentage as between 1945 and 1965.
But the depression that started in 1882 led to a dramatic decline in U.S. livelihoods. Then as now, parents brought their children into a world with fewer opportunities than they’d had.
That’s where the historical parallels become telling.
After that depression, the U.S. financial sector rapidly accumulated wealth and power. It’s when the scions of the Gilded Age, like Cornelius Vanderbilt and JP Morgan, got their start.
That wealth came from the growth of credit markets. Credit tends to transfer wealth from the bottom to the top.
American families struggling to make ends meet borrowed from banks owned by the superrich. The more they struggled, the more they depended on credit.
The stream of repayments from those loans helped to create wealth unlike anything the U.S. had ever seen. It made the U.S. wildly unequal … because the interest from all those loan repayments ended up in the bank accounts of the super wealthy.
That’s why the Gilded Age leading up to World War I was one of the most conflicted in our country’s history.
The New Gilded Age
The charts below show the relative income growth of six different groups of Americans since 1976. It’s a remarkably close fit to what happened in the Gilded Age.
The richer you were, the more your income grew … just like then.
From 1976 to today, the income of the top 1% grew by over 250%, while that of the bottom 50% of the population only grew by 25%:
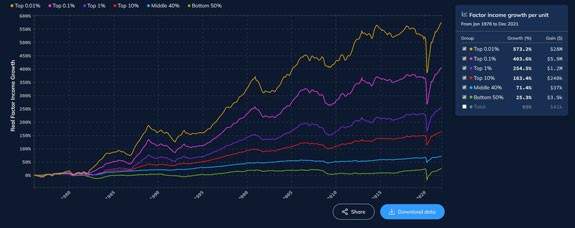
(Click here to view larger image.)
The top 10% of the U.S. population added $7.6 trillion to their income, while the bottom 50% only added $1 trillion:
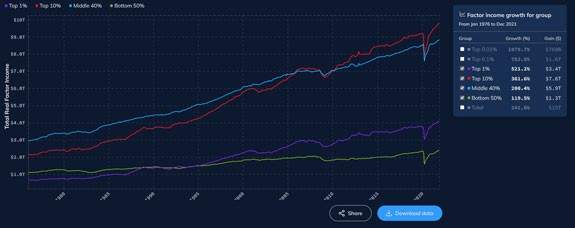
(Click here to view larger image.)
In other words, we’re repeating the Gilded Age.
History Doesn’t Repeat … but It Does Rhyme
Extremely unequal societies reward investors at first. But eventually the magic wears off.
The core dynamic is that we do very well as the abundance of easy finance encourages an increase in stock prices. But the same dynamic that produces easy finance also produces people who would like to hijack your car at a red light in the middle of the night … or organize aggressively anti-capitalist social and political movements.
And that, in turn, is a massive disincentive to further business and investment.
Eventually investor returns decline to nothing … or worse.
This is a story I’ve been telling ever since I started writing financial newsletters. To my knowledge, nobody else in this business pays much attention to it.
I’m a big picture guy. I take the long view.
In turbulent times like these, investors should look for stability … and above all, to supply and demand dynamics that mean a company will keep on making money no matter what’s happening to the rest of society.
And that’s exactly what I’ve dished up for my next Bauman Letter monthly report!
Kind regards,

Ted Bauman
Editor, The Bauman Letter


