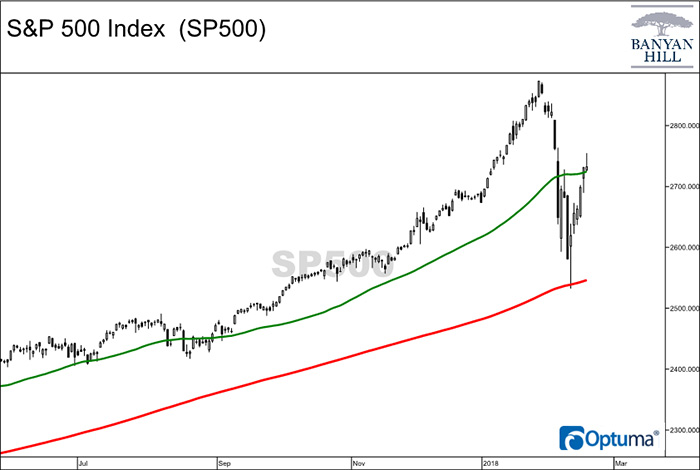
The S&P 500 has traded in a narrow range lately, and that is all about to change.
Whenever a price of any asset ends up trading range bound, it doesn’t last long. The bulls and bears are building positions at the moment, and very soon, we’ll know which way prices will break.
And the holdup on all of this comes at an important level for any stock — its 50-day moving average.
Moving averages are some of the oldest technical indicators, and are mostly used to determine the trend by the slope of the moving averages. But they also act as critical support and resistance levels. And that’s exactly what the S&P 500 has been trading based on. Take a look:

The green line is the 50-day moving average, and you can see prices are right at that level. The red line is the 200-day moving average.
Now, you can see a thin black line touch it a few days ago. That’s why I used a candlestick chart for this image. I wanted you to see that it tested that level once already.
That’s how I know a test of either the highs from January 26 or the lows from February 9 is coming soon … real soon.
These are the two previous key levels of support and resistance, and will be the next big levels for the S&P 500 to test.
Ultimately, we don’t know which way it will go — none of us have that kind of power. But I know one of these levels will be tested any day now, and whether or not that level holds will tell us what to expect for the rest of the year.
Regards,

Chad Shoop, CMT
Editor, Automatic Profits Alert


